3  Reading Data

Before you can work with a set of data, you have to bring it into the programming environment.

If you are working with proprietary data analytics tools such as SAS, SPSS, Stata, etc., you probably do not worry much about the ways in which data are stored, read, and written by the software, except that you want the tool to support import from and export to your favorite non-proprietary format.

Most statistics and data science today is performed on (a) data in databases and (b) data stored in open-source or open standard file formats. Proprietary formats are not easily exchanged between tools and applications and are increasingly frowned upon. Data science spans many technologies and storing data in a form accessible by only a subset of the tools is counterproductive. You end up reformatting the data into an exchangeable format at some point anyway.

The most important file formats in data science are CSV, JSON, and Parquet, but also Avro and ORC. CSV and JSON are text-based, human-readable formats, whereas Parquet, Avro, and ORC are binary formats. The last three were designed specifically to handle Big Data use cases and are Apache open-source projects.

The second important source for data are databases. They store the data in a form specific to the database engine and you interact with the data through a database management system (DBMS). The syntax of the DBMS is typically a SQL (Structured Querying Language; pronounced “sequel”, like the follow-up movie) if the database architecture is relational. Even No-SQL non-relational databases such as MongoDB have a specific syntax to interface with the information in the database. In other words, when your data is stored in a database you need to use database-specific tools to read and write the data. In the case of analytic databases you should also use the computational power of the database engine to perform analytic calculations in the database.

3.1 Tabular Data

The basic function to read tabular data into R is read.table. read.csv is a special case of read.table for CSV files with defaults such as sep="," that make sense for CSV (comma-separated values) files.

On CSV Files

OK, time for a rant. CSV files are ubiquitous and going through college one could get the impression that most data is stored in CSV format. First, that does not hold for the real world. Second, CSV is a horrible format for data. It does have some advantages

  • Ubiquitous: every data tool can read and write CSV files. It is thus a common format to exchange (export/import) data between tools and applications.

  • Human readable: since the column names and values are stored in plain text, it is easy to look at the contents of a CSV file. When data are stored in binary form, you need to know exactly how the data are laid out in the file to access it.

  • Compression: it is easy to compress CSV files.

  • Excel: CSV files are easily exported from and imported to Microsoft Excel.

  • Simple: the structure of the files is straightforward to understand and can represent tabular data well if the data types can be converted to text characters.

There are some considerable disadvantages of CSV files, however:

  • Human readable: To prevent exposing the contents of the file you need to use access controls and/or encryption. It is not a recommended file format for sensitive data.

  • Simple structure: Complex data types such as documents with multiple fields and sub-fields cannot be stored in CSV files.

  • Plain text: Some data types cannot be represented as plain text, for example, images, audio, and video. If you kluge binary data into a text representation the systems writing and reading the data need to know how to kluge and un-kluge the information—it is not a recommended practice.

  • Efficiency: much more efficient formats for storing data exist, especially for large data sets.

  • Broken: CSV files can be easily broken by applications. Examples include inserting line breaks, limiting line width, not handling embedded quotes correctly, blank lines.

  • Missing values (NaNs): The writer and reader of CSV files need to agree how to represent missing values and values representing not-a-number. Inconsistency between writing and reading these values can have disastrous consequences For example, it is a bad but common practice to code missing values with special numbers such as 99999 (called “sentinel values”). How does the application reading the file know this is the code for a missing value?

  • Encodings: When CSV files contain more than plain ASCII text, for example, emojis or Unicode characters, the file cannot be read without knowing the correct encoding (UTF-8, UTF-16, EBCDIC, US-ASCII, etc.). Storing encoding information in the header section of the CSV file throws off CSV reader software that does not anticipate the extra information.

  • Metadata: The only metadata supported by the CSV format are the column names in the first row of the file. This information is optional and you will find CSV files without column names. Additional metadata common about columns in a table such as data types, format masks, number-to-string maps, cannot be stored in a CSV file.

  • Data Types: Data types need to be inferred by the CSV reader software when scanning the file. There is no metadata in the CSV header to identify data types, only column names.

  • Loss of Precision: Floating point numbers are usually stored in CSV files with fewer decimal places than their internal representation in the computer. A double-precision floating point number occupies 64-bits (8 bytes) and has 15 digits of precision. Although it is not necessary, floating-point numbers are often rounded or truncated when they are converted to plain text.

Despite these drawbacks, CSV is one of the most common file formats. It is the lowest common denominator format to exchange data between disparate systems.

Here is an example of reading a CSV file into R. The stringsAsFactors=TRUE argument requests that all character variables are converted into factors.

pisa <- read.csv(file="data/pisa.csv",stringsAsFactors=TRUE)
pisa[1:10,]
                Country MathMean MathShareLow MathShareTop ReadingMean
1        Shanghai-China      613          3.8         55.4         570
2             Singapore      573          8.3         40.0         542
3  Hong Kong SAR, China      561          8.5         33.7         545
4        Chinese Taipei      560         12.8         37.2         523
5                 Korea      554          9.1         30.9         536
6      Macao SAR, China      538         10.8         24.3         509
7                 Japan      536         11.1         23.7         538
8         Liechtenstein      535         14.1         24.8         516
9           Switzerland      531         12.4         21.4         509
10          Netherlands      523         14.8         19.3         511
   ScienceMean      GDPp  logGDPp HighIncome
1          580   6264.60  8.74267      FALSE
2          551  54451.21 10.90506       TRUE
3          555  36707.77 10.51074       TRUE
4          523        NA       NA         NA
5          538  24453.97 10.10455       TRUE
6          521  77145.04 11.25344       TRUE
7          547  46701.01 10.75152       TRUE
8          525 149160.76 11.91278       TRUE
9          515  83208.69 11.32911       TRUE
10         522  49474.71 10.80922       TRUE

Note that there are missing values for Chinese Taipei in row 4. This is the result of correctly specifying the contents of the comma-separated file. For this row the entries of the CSV files read

"Chinese Taipei",560,12.8,37.2,523,523,,,

The sequence of commas indicates that the values for the corresponding variables are unobserved and will be set to missing.

By default, read.csv looks for information about the column names in the first row of the CSV file. If names are not available in the first row, add the header=FALSE option to the function call. Other important options for read.csv and read.table are

  • sep: specifies the character that separates the values of the columns, for read.csv this defaults to sep=",". For read.table the separator defaults to sep="".
  • skip: how many lines to skip at the top of the file before reading data. This is useful if the CSV file has a comment section at the top.
  • nrow: how many rows of data to read. Useful if you want to import only a portion of the file.
  • dec: specifies the character that indicates a decimal point.
  • na.strings: a vector of character values that are interpreted as missing (NA) values. I hope you do not need to specify those—using sentinel values to indicate missing values is very dangerous.

3.2 Excel Files

The readxl library is part of the tidyverse.

library(readxl)
df_tesla <- read_excel("data/TeslaDeaths.xlsx", sheet=1)
df_tesla[1:10,]
# A tibble: 10 × 26
   `Case #`  Year Date  Country State Description          Deaths `Tesla driver`
      <dbl> <dbl> <chr> <chr>   <chr> <chr>                 <dbl> <chr>         
 1     426   2024 45457 USA     CA    Scooter hit               1 -             
 2     425   2024 45454 USA     CA    Tesla flips               3 -             
 3     424   2024 45452 USA     CA    Pedestrian hit            1 -             
 4     423.  2024 45451 USA     FL    Motorcycle hits Tes…      1 -             
 5     423   2024 45446 USA     TX    Tesla hits parked t…      1 1             
 6     422   2024 45444 USA     MD    Tesla hit motorcycle      1 -             
 7     421   2024 45441 USA     WA    Tesla runs red ligh…      1 -             
 8     420   2024 45438 USA     FL    Tesla crashes into …      1 1             
 9     419   2024 45436 Germany -     Tesla crashes under…      1 1             
10     418   2024 45435 UK      -     Three-way crash           1 1             
# ℹ 18 more variables: `Tesla occupant` <chr>, `Other vehicle` <chr>,
#   `Cyclists/ Peds` <chr>, `TSLA+cycl / peds` <chr>, Model <chr>,
#   `Autopilot claimed` <chr>, `Reported in NHTSA SGO` <chr>,
#   `Verified Tesla Autopilot Deaths` <chr>,
#   `Excerpt Verifying Tesla Autopilot Deaths` <chr>,
#   `Verified FSD Beta Death` <lgl>, ...19 <chr>, ...20 <chr>, Source <chr>,
#   Note <chr>, `Deceased 1` <chr>, `Deceased 2` <chr>, `Deceased 3` <chr>, …

3.3 JSON Files

JSON stands for JavaScript Object Notation, and although it was borne out of interoperability concerns for JavaScript applications, it is a language-agnostic data format. Initially used to pass information in human readable form between applications over APIs (Application Programmer Interfaces), JSON has grown into a general-purpose format for text-based, structured information. It is the standard for communicating data on the web. The correct pronunciation of JSON is like the name “Jason”, but “JAY-sawn” has become common.

In contrast to CSV, JSON is not based on rows of data but three basic data elements:

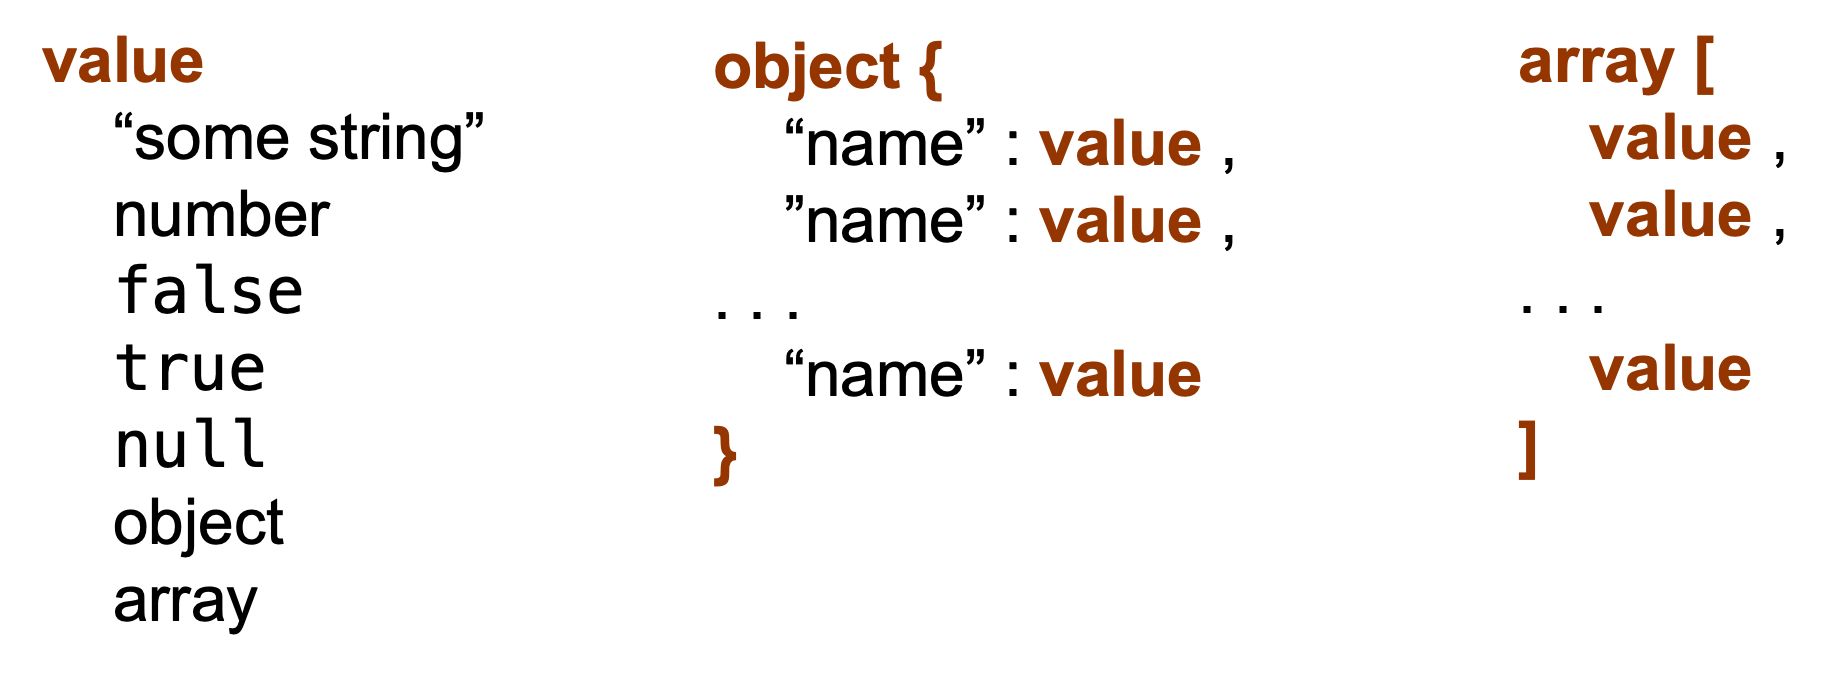
  • Value: a string, number, reserved word, or one of the following:

  • Object: a collection of name—value pairs similar to a key-value store.

  • Array: An ordered list of values

All modern programming languages support key—values and arrays, they might be calling it by different names (object, record, dictionary, struct, list, sequence, map, hash table, …). This makes JSON documents highly interchangeable between programming languages—JSON documents are easy to parse (read) and write by computers. Any modern data processing system can read and write JSON data, making it a frequent choice to share data between systems and applications.

A value in JSON can be a string in double quotes, a number, true, false, or null, an object or an array (Figure 3.1). An array is an ordered collection of values. Objects are unordered collection of name—value pairs. Since values can contain objects and arrays, JSON allows highly nested data structures that do not fit the tabular row–column structure of CSV files.

JSON documents are self-describing, the schema to make the data intelligible is built into the structures. It is also a highly flexible format that does not impose any structure on the data, except that it must comply with the JSON rules and data types.

As a human-readable, non-binary format, JSON shares some of the advantages and disadvantages with CSV files. You do not want to pass sensitive information in JSON format without encryption. The level of human readability is lower for JSON files. The format is intended to make algorithms interoperable, not to make human interpretation simple.

Since so much data is stored in JSON format, you need to get familiar and comfortable with working with JSON files. Data science projects are more likely consumers of JSON files rather than producer of files.

There are multiple packages for working with JSON files in R, for example, jsonlite and rjson. Here we use the jsonlite package. The toJSON and fromJSON functions are used to convert R objects to/from JSON. read_json and write_json read and write JSON files. They are similar to fromJSON and toJSON but recognize a file path as input.

The following example is taken from Datacarpentry.org. SAFI (Studying African Farmer-Led Irrigation) is a study of farming and irrigation methods in Tanzania and Mozambique. The survey data was collected through interviews conducted between November 2016 and June 2017.

If you use read_json with the default settings, the JSON document is converted into a list (simplifyVector=FALSE). To convert JSON format into vectors and data frames, use simplifyVector=TRUE.

library(jsonlite)
json_data <- read_json("data/SAFI.json", simplifyVector=TRUE)

To take a look at the data frame created with read_json we use the glimpse function from tidyverse. It works a bit like the str function in base R but has a more compact display for this case and shows more data points.

library(tidyverse)
glimpse(json_data)
Rows: 131
Columns: 74
$ C06_rooms                      <int> 1, 1, 1, 1, 1, 1, 1, 3, 1, 5, 1, 3, 1, …
$ B19_grand_liv                  <chr> "no", "yes", "no", "no", "yes", "no", "…
$ A08_ward                       <chr> "ward2", "ward2", "ward2", "ward2", "wa…
$ E01_water_use                  <chr> "no", "yes", "no", "no", "no", "no", "y…
$ B18_sp_parents_liv             <chr> "yes", "yes", "no", "no", "no", "no", "…
$ B16_years_liv                  <int> 4, 9, 15, 6, 40, 3, 38, 70, 6, 23, 20, …
$ E_yes_group_count              <chr> NA, "3", NA, NA, NA, NA, "4", "2", "3",…
$ F_liv                          <list> [<data.frame[1 x 2]>], [<data.frame[3 …
$ `_note2`                       <lgl> NA, NA, NA, NA, NA, NA, NA, NA, NA, NA,…
$ instanceID                     <chr> "uuid:ec241f2c-0609-46ed-b5e8-fe575f6ce…
$ B20_sp_grand_liv               <chr> "yes", "yes", "no", "no", "no", "no", "…
$ F10_liv_owned_other            <lgl> NA, NA, NA, NA, NA, NA, NA, NA, NA, NA,…
$ `_note1`                       <lgl> NA, NA, NA, NA, NA, NA, NA, NA, NA, NA,…
$ F12_poultry                    <chr> "yes", "yes", "yes", "yes", "yes", "no"…
$ D_plots_count                  <chr> "2", "3", "1", "3", "2", "1", "4", "2",…
$ C02_respondent_wall_type_other <lgl> NA, NA, NA, NA, NA, NA, NA, NA, NA, NA,…
$ C02_respondent_wall_type       <chr> "muddaub", "muddaub", "burntbricks", "b…
$ C05_buildings_in_compound      <int> 1, 1, 1, 1, 1, 1, 1, 2, 2, 1, 2, 2, 1, …
$ `_remitters`                   <list> [<data.frame[0 x 0]>], [<data.frame[0 …
$ E18_months_no_water            <list> <NULL>, <"Aug", "Sept">, <NULL>, <NULL…
$ F07_use_income                 <chr> NA, "Alimentação e pagamento de educa…
$ G01_no_meals                   <int> 2, 2, 2, 2, 2, 2, 3, 2, 3, 3, 2, 3, 2, …
$ E17_no_enough_water            <chr> NA, "yes", NA, NA, NA, NA, "yes", "yes"…
$ F04_need_money                 <chr> NA, "no", NA, NA, NA, NA, "no", "no", "…
$ A05_end                        <chr> "2017-04-02T17:29:08.000Z", "2017-04-02…
$ C04_window_type                <chr> "no", "no", "yes", "no", "no", "no", "n…
$ E21_other_meth                 <chr> NA, "no", NA, NA, NA, NA, "no", "no", "…
$ D_no_plots                     <int> 2, 3, 1, 3, 2, 1, 4, 2, 3, 2, 2, 2, 4, …
$ F05_money_source               <list> <NULL>, <NULL>, <NULL>, <NULL>, <NULL>…
$ A07_district                   <chr> "district1", "district1", "district1", …
$ C03_respondent_floor_type      <chr> "earth", "earth", "cement", "earth", "e…
$ E_yes_group                    <list> [<data.frame[0 x 0]>], [<data.frame[3 …
$ A01_interview_date             <chr> "2016-11-17", "2016-11-17", "2016-11-17…
$ B11_remittance_money           <chr> "no", "no", "no", "no", "no", "no", "no…
$ A04_start                      <chr> "2017-03-23T09:49:57.000Z", "2017-04-02…
$ D_plots                        <list> [<data.frame[2 x 8]>], [<data.frame[3 …
$ F_items                        <list> [<data.frame[3 x 3]>], [<data.frame[2 …
$ F_liv_count                    <chr> "1", "3", "1", "2", "4", "1", "1", "2",…
$ F10_liv_owned                  <list> "poultry", <"oxen", "cows", "goats">, …
$ B_no_membrs                    <int> 3, 7, 10, 7, 7, 3, 6, 12, 8, 12, 6, 7, …
$ F13_du_look_aftr_cows          <chr> "no", "no", "no", "no", "no", "no", "no…
$ E26_affect_conflicts           <chr> NA, "once", NA, NA, NA, NA, "never", "n…
$ F14_items_owned                <list> <"bicycle", "television", "solar_panel…
$ F06_crops_contr                <chr> NA, "more_half", NA, NA, NA, NA, "more_…
$ B17_parents_liv                <chr> "no", "yes", "no", "no", "yes", "no", "…
$ G02_months_lack_food           <list> "Jan", <"Jan", "Sept", "Oct", "Nov", "…
$ A11_years_farm                 <dbl> 11, 2, 40, 6, 18, 3, 20, 16, 16, 22, 6,…
$ F09_du_labour                  <chr> "no", "no", "yes", "yes", "no", "yes", …
$ E_no_group_count               <chr> "2", NA, "1", "3", "2", "1", NA, NA, NA…
$ E22_res_change                 <list> <NULL>, <NULL>, <NULL>, <NULL>, <NULL>…
$ E24_resp_assoc                 <chr> NA, "no", NA, NA, NA, NA, NA, "yes", NA…
$ A03_quest_no                   <chr> "01", "01", "03", "04", "05", "6", "7",…
$ `_members`                     <list> [<data.frame[3 x 12]>], [<data.frame[7…
$ A06_province                   <chr> "province1", "province1", "province1", …
$ `gps:Accuracy`                 <dbl> 14, 19, 13, 5, 10, 12, 11, 9, 11, 14, 1…
$ E20_exper_other                <chr> NA, "yes", NA, NA, NA, NA, "yes", "yes"…
$ A09_village                    <chr> "village2", "village2", "village2", "vi…
$ C01_respondent_roof_type       <chr> "grass", "grass", "mabatisloping", "mab…
$ `gps:Altitude`                 <dbl> 698, 690, 674, 679, 689, 692, 709, 700,…
$ `gps:Longitude`                <dbl> 33.48346, 33.48342, 33.48345, 33.48342,…
$ E23_memb_assoc                 <chr> NA, "yes", NA, NA, NA, NA, "no", "yes",…
$ E19_period_use                 <dbl> NA, 2, NA, NA, NA, NA, 10, 10, 6, 22, N…
$ E25_fees_water                 <chr> NA, "no", NA, NA, NA, NA, "no", "no", "…
$ C07_other_buildings            <chr> "no", "no", "no", "no", "no", "no", "ye…
$ observation                    <chr> "None", "Estes primeiros inquéritos na…
$ `_note`                        <lgl> NA, NA, NA, NA, NA, NA, NA, NA, NA, NA,…
$ A12_agr_assoc                  <chr> "no", "yes", "no", "no", "no", "no", "n…
$ G03_no_food_mitigation         <list> <"na", "rely_less_food", "reduce_meals…
$ F05_money_source_other         <lgl> NA, NA, NA, NA, NA, NA, NA, NA, NA, NA,…
$ `gps:Latitude`                 <dbl> -19.11226, -19.11248, -19.11211, -19.11…
$ E_no_group                     <list> [<data.frame[2 x 6]>], [<data.frame[0 …
$ F14_items_owned_other          <lgl> NA, NA, NA, NA, NA, NA, NA, NA, NA, NA,…
$ F08_emply_lab                  <chr> "no", "yes", "no", "no", "no", "no", "n…
$ `_members_count`               <chr> "3", "7", "10", "7", "7", "3", "6", "12…
Because of the deeply nested structure of JSON documents, flattening the data into a two-dimensional data frame can go only so far. Several of the columns are lists and some are lists of data frames.

json_data %>%
    select(where(is.list)) %>%
    glimpse()
Rows: 131
Columns: 14
$ F_liv                  <list> [<data.frame[1 x 2]>], [<data.frame[3 x 2]>], …
$ `_remitters`           <list> [<data.frame[0 x 0]>], [<data.frame[0 x 0]>], …
$ E18_months_no_water    <list> <NULL>, <"Aug", "Sept">, <NULL>, <NULL>, <NULL…
$ F05_money_source       <list> <NULL>, <NULL>, <NULL>, <NULL>, <NULL>, <NULL>…
$ E_yes_group            <list> [<data.frame[0 x 0]>], [<data.frame[3 x 14]>],…
$ D_plots                <list> [<data.frame[2 x 8]>], [<data.frame[3 x 8]>], …
$ F_items                <list> [<data.frame[3 x 3]>], [<data.frame[2 x 3]>], …
$ F10_liv_owned          <list> "poultry", <"oxen", "cows", "goats">, "none", …
$ F14_items_owned        <list> <"bicycle", "television", "solar_panel", "tabl…
$ G02_months_lack_food   <list> "Jan", <"Jan", "Sept", "Oct", "Nov", "Dec">, <…
$ E22_res_change         <list> <NULL>, <NULL>, <NULL>, <NULL>, <NULL>, <NULL>…
$ `_members`             <list> [<data.frame[3 x 12]>], [<data.frame[7 x 12]>]…
$ G03_no_food_mitigation <list> <"na", "rely_less_food", "reduce_meals", "day_…
$ E_no_group             <list> [<data.frame[2 x 6]>], [<data.frame[0 x 0]>], …

You access the data frames stored within the lists simply as any other list element in R.

str(json_data$F_liv[[2]])
'data.frame':   3 obs. of  2 variables:
 $ F11_no_owned: int  4 3 4
 $ F_curr_liv  : chr  "oxen" "cows" "goats"
json_data$F_liv[[2]]
  F11_no_owned F_curr_liv
1            4       oxen
2            3       cows
3            4      goats

3.4 Parquet Files

The Apache Parquet open-source file format is a binary format—data are not stored in plain text but in binary form. Originally conceived as a column-based file format in the Hadoop ecosystem, it has become popular as a general file format for analytical data inside and outside of Hadoop and its file system HDFS: for example, as an efficient analytic file format for data exported to data lakes or in data processing with Spark. Many organizations have switched to storing their data in Parquet files; loading Parquet files from AWS S3 buckets or from Google Cloud Storage or Microsoft Azure Blob storage has become a common access pattern.

Working with Parquet files for large data is an order of magnitude faster than working with CSV files. The drawbacks of CSV files discussed previously all melt away with Parquet files.

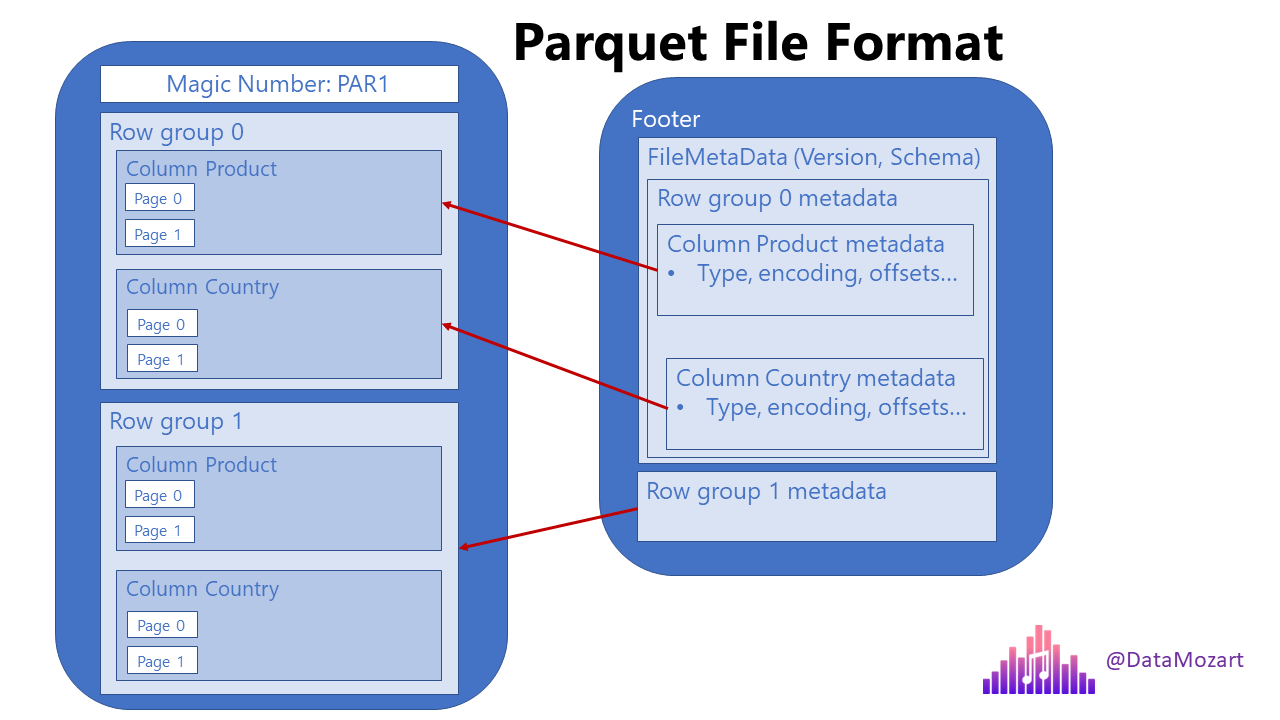
Parquet was designed from the ground up with complex data structures and read-heavy analytics in mind. It uses principally columnar storage but does it cleverly by storing chunks of columns in row groups rather than entire columns.

This hybrid storage model is very efficient when queries select specific columns and filter rows at the same time; a common pattern in data science: compute the correlation between homeValue and NumberOfRooms for homes where ZipCode = 24060.

Parquet stores metadata about the row chunks to speed access to rows, the metadata tells the reader which row chunks to skip. Also, a single write to the Parquet format can generate multiple .parquet files. The total data is divided into multiple files collected within a folder. Like NoSQL and NewSQL databases, data are partitioned, but since Parquet is a file format and not a database engine, the partitioning results in multiple files. This is advantageous for parallel processing frameworks like Spark that can work on multiple partitions (files) concurrently.

Parquet uses several compression techniques to reduce the size of the files such as run-length encoding, dictionary encoding, Snappy, GZip, LZO, LZ4, ZSTD. Because of columnar storage, compression methods can be specified on a per-column basis; Parquet files compress much more than text-oriented CSV files.

Because of its complex file structure, Parquet files are relatively slow to write. The file format is optimized for the WORM paradigm: write-once, read many times.

Comparison of popular file formats in data science.
CSV JSON Parquet
Columnar No No Yes
Compression Yes Yes Yes
Human Readable Yes Yes No
Nestable No Yes Yes
Complex Data Structures No Yes Yes
Named Columns Yes, if in header Based on scan Yes, metadata
Data Types Based on scan Based on scan Yes, metadata

To read a file in Parquet format into an R session, install and load the arrow package. Apache Arrow is an open-source development platform for in-memory analytics that supports many programming environments, including R and Python. The arrow libraries support reading and writing of the important file formats in this ecosystem.

#install.packages("arrow")
library(arrow)
read_parquet("somefile.parquet")

3.5 Working with a Database

You interface with a database from R with the DBI package. It provides a common syntax and functions to connect to supported databases, and to send queries to the database. In addition to the DBI package you need the driver packages specific to the database you are working with (RMySQL for MySQL, RSQLite for SQLite, and so on).

My favorite database for analytic work is DuckDB, a highly efficient, embedded database designed for processing data analytically. The file ads.ddb, contains the database tables used in this and other courses in DuckDB format. To add the DuckDB driver package to your system, use

install.packages("duckdb")

Reading a DuckDB Table

To read a table from that database into an R data frame, follow the steps in the next code snippet:

1library("duckdb")
2con <- dbConnect(duckdb(),dbdir = "ads.ddb",read_only=TRUE)
3fit <- dbGetQuery(con, "SELECT * FROM fitness")
4dbDisconnect(con)
1
Load the duckdb library
2
Make a connection to DuckDB through the DBI interface, specifying the database you want to work with, here ads.ddb. Choosing read_only=TRUE opens the connection in read-only mode. You cannot write to the database, but it can be shared in this mode by multiple R processes.
3
Send a SELECT * FROM query to read the contents of the target table and assign the result to a dataframe in R
4
Close the connection to the database when you are done querying it.

We can now work with the fitness data set as a dataframe in R:

head(fit)
  Age Weight Oxygen RunTime RestPulse RunPulse MaxPulse
1  44  89.47 44.609   11.37        62      178      182
2  40  75.07 45.313   10.07        62      185      185
3  44  85.84 54.297    8.65        45      156      168
4  42  68.15 59.571    8.17        40      166      172
5  38  89.02 49.874    9.22        55      178      180
6  47  77.45 44.811   11.63        58      176      176
summary(fit)
      Age            Weight          Oxygen         RunTime     
 Min.   :38.00   Min.   :59.08   Min.   :37.39   Min.   : 8.17  
 1st Qu.:44.00   1st Qu.:73.20   1st Qu.:44.96   1st Qu.: 9.78  
 Median :48.00   Median :77.45   Median :46.77   Median :10.47  
 Mean   :47.68   Mean   :77.44   Mean   :47.38   Mean   :10.59  
 3rd Qu.:51.00   3rd Qu.:82.33   3rd Qu.:50.13   3rd Qu.:11.27  
 Max.   :57.00   Max.   :91.63   Max.   :60.05   Max.   :14.03  
   RestPulse        RunPulse        MaxPulse    
 Min.   :40.00   Min.   :146.0   Min.   :155.0  
 1st Qu.:48.00   1st Qu.:163.0   1st Qu.:168.0  
 Median :52.00   Median :170.0   Median :172.0  
 Mean   :53.45   Mean   :169.6   Mean   :173.8  
 3rd Qu.:58.50   3rd Qu.:176.0   3rd Qu.:180.0  
 Max.   :70.00   Max.   :186.0   Max.   :192.0  

The connection to the database can be left open until you are done working with the database. If you use the database to import tables at the beginning of a statistical program, it is recommended to close the connection as soon as that step is complete.

Because we are reading many tables from the ads.ddb database, you can write a function to wrap the database operations. The following function loads the duckdb library unless it is already loaded, and reads a table, possibly selecting rows with a WHERE filter, and returns the R dataframe.

duckload <- function(tableName, whereClause=NULL, dbName="ads.ddb") {
    if (!is.null(tableName)) {
        if (!("duckdb" %in% (.packages()))) {
            suppressWarnings(library("duckdb"))
            message("duckdb library was loaded to execute duckload().")

        }
        con <- dbConnect(duckdb(), dbdir=dbName, read_only=TRUE)
        query_string <- paste("SELECT * from ", tableName)
        if (!is.null(whereClause)) {
            query_string <- paste(query_string, " WHERE ", whereClause)
        }
        df_ <- dbGetQuery(con, query_string)
        dbDisconnect(con)
        return (df_)
    } else {
        return (NULL)
    }
}
# Load the entire table
fit <- duckload("fitness")

# Load only the records where Age > 50
fit2 <- duckload("fitness",whereClause="Age > 50")

# Load only the records where Age = 40
fit3 <- duckload("fitness","Age = 40")

You can modify the function to load a projection of columns from the database table by replacing the * in the SELECT query with the selected columns.

Creating an In-memory Data Base

You can create and work with a purely in-memory database with DuckDB. The database is instantiated in the R session and goes away when the R session terminates or when you close the connection. To specify an in-memory database, simply do not specify the dbdir= parameter when opening a connection, or specify dbdir = ":memory:".

Since the default for read_only is read_only=FALSE, the following statement opens a connection to an in-memory database that you can write to.

con <- dbConnect(duckdb())

To write an R data frame to this (or any other) DuckDB database, use the dbWriteTable function.

set.seed(43)
df <- data.frame(matrix(rnorm(100),nrow=20,ncol=5))
dbWriteTable(con,"gauss_vars",df)
dbWriteTable(con,"iris_data",iris)
dbGetQuery(con,"SHOW TABLES;")
        name
1 gauss_vars
2  iris_data

This closes the connection and because the database exists in memory, releases the memory (and destroys the database).

dbDisconnect(con)

3.6 Saving and Loading RData

R has its own format (binary or ASCII) to read and write R objects. This is convenient to save a data frame to disk and later load it back into an R session.

To save any R object, use the save or saveRDS function, to load it into an R session use the load function. save can save one or more objects to a .RData file, while saveRDS creates an .RDS file from a single object.

a <- matrix(rnorm(200),nrow=50,ncol=4)
b <- crossprod(a)
cor_mat <- cor(a)
save(a,b,cor_mat,file="data/matrixStuff.RData")

Before reloading the objects, let’s clear them from the environment, so we can see how load brings them back into the environment:

rm(list=c("a","b","cor_mat"))
load("data/matrixStuff.RData")

When you load R objects from a .RData file, you do not assign the result of the function. The objects are created in the work environment with their original names.

Caution

The load operation will overwrite any R objects in your environment by the same name as those in the RData file.

.RData files can contain many objects, for example, all the objects in your environment when it is saved upon closing an R session. If you load from an .RDS file, you can assign the result to an R object which helps avoid name collisions.

In general, it is better coding practice to use saveRDS and readRDS with single objects. The code is cleaner and easier to follow if single objects are saved/loaded and these are explicitly named in the code.

saveRDS(a, file = "data/stuff.RDS") 

normal_rvs <- readRDS("data/stuff.RDS")