25  Cluster Analysis

25.1 Introduction

The term cluster appears throughout data analytics in different contexts. In the analysis of correlated data a cluster is a group of observations that belong together and group membership is known a priori. For example, a subsample that is drawn from a larger sampling unit creates a hierarchy of sampling units. The longitudinal observations collected on a subject over time form a cluster of subject-specific data. The data from different subjects might be independent while the longitudinal observations within a cluster (a subject) are correlated.

In unsupervised learning, a cluster is a group of observations that are somehow similar. Group membership is not known a priori and determining membership as well as the number of clusters is part of the analysis. Examples are

  • Students that are similar with respect to STEM achievement scores
  • Real estate properties that share similar property attributes
  • Online shoppers with similar browsing and purchase history

Cluster analysis seeks to find groups of data such that members within a group are similar to each other and members from different groups are dissimilar. It is an unsupervised method, there is no target variable, we simply are trying to find structure in the data. The number of clusters can be set a priori, for example in \(k\)-means clustering, or be determined as part of analysis, as in hierarchical clustering.

Clustering Rows or Columns

Note that we are looking for groups of “data”, we did not specify whether clustering applies to finding similar observations or similar features. Usually it is the former, and clustering columns versus rows can be performed by simply transposing the data. From here on we assume that clustering is seeking similar groups of observations.

Scaling and Centering

Key to all clustering methods is some notion of similarity–or the opposite, dissimilarity–of data points. Measures of similarity (or dissimilarity) depend on a metric expressing distance. Squared Euclidean distance is a common choice, but other metrics such as the Manhattan (city-block) distance, correlation distance, or Gower’s distance are also important. Many distance measures depend on the units of measurement; variables with large values tend to dominate the distance calculations. It is highly recommended to scale data prior to cluster analysis to put features on equal footing.

Scaling is often not applied to binary variables, for example, variables that result from coding factors as a series of 0/1 variables.

25.2 \(K\)-Means Clustering

Introduction

\(K\)-means clustering is an intuitive method to cluster \(p\) numeric input variables. The value \(K\) is the number of clusters and is set a priori. If you perform a \(3\)-means analysis, the algorithm will assign all observations to one of three clusters. If you perform a \(100\)-means analysis, the algorithm will assign all observations to one of 100 clusters. Choosing the appropriate number of clusters for a data set uses scree plots similar to choosing the number of components in principal component analysis.

The \(K\)-means algorithm has the following properties:

  • The analysis leads to \(K\) clusters
  • Every observation belongs to exactly one cluster
  • No observation belongs to more than one cluster

Finding the optimal partitioning of \(n\) observations into \(K\) groups is a formidable computational problem, there are approximately \(K^n\) ways of partitioning the data. However, efficient algorithms exist to find at least a local solution to the global partitioning problem.

To introduce some notation for \(K\)-means clustering, let \(C_i\) denote the set of observations assigned to cluster \(i=1,\cdots,K\). The \(K\)-means properties imply that

  • \(C_1 \cup C_2 \cup \cdots \cup C_K = \{1,\cdots, n\}\)
  • \(C_i \cap C_j = \emptyset\) if \(i \neq j\)

The number of observations in cluster \(i\) is called its cardinality, denoted \(|C_i|\).

If squared Euclidean distance is the dissimilarity measure of choice, the distance between two data points is \[ d(\textbf{x}_i,\textbf{x}_j) = ||\textbf{x}_i - \textbf{x}_j||_2^2 = \sum_{m=1}^p \left ( x_{im} - x_{jm} \right )^2 \] The within-cluster variation in cluster \(k\) is the average dissimilarity of the observations in \(C_k\): \[ W(C_k) = \frac{1}{|C_k|} \sum_{i,j \in C_k} ||\textbf{x}_i - \textbf{x}_j||_2^2 \] Let \(\overline{\textbf{x}}_k = [\overline{x}_{1k},\cdots,\overline{x}_{pk}]\) be the vector of means of the inputs in the \(k\)th cluster. Finding the \(K\)-means solution requires to find the cluster allocations such that \[ \min_{C_1,\cdots, C_k} \left \{ \sum_{k=1}^K W(C_k) \right \} \Longleftrightarrow \min_{C_1,\cdots, C_k} \left \{ \sum_{k=1}^K \sum_{i \in C_k} ||\textbf{x}_i - \overline{\textbf{x}}_k||_2 ^2 \right \} \]

This states that the cluster assignment that minimizes the sum of the within-cluster dissimilarity is the same assignment that minimizes the distances of data points from the cluster centroid. This is how \(K\)-means clustering gets its name; the cluster centroids are computed as the mean of the observations assigned to the cluster.

The within-cluster sum of squares is the sum of the squared distances between the data points in a cluster and the cluster centroid. For cluster \(k\) this sum of squares is \[ \text{SSW}_k = \frac{1}{2} W(C_k) = \sum_{i \in C_k} ||\textbf{x}_i - \overline{\textbf{x}}_k||_2 ^2 \] This quantity is also called the inertia of the cluster. The average inertia, \[ \frac{1}{|C_k|} \text{SSW}_k \] is called the distortion of cluster \(k\).

A (local) solution is found by iterating from an initial cluster assignment: given cluster centroids \(\overline{\textbf{x}}_k\) assign each observation to the cluster whose center is closest. Following the assignment recompute the centers. Continue until the cluster assignment no longer changes. At the local solution no movement of a data point from one cluster to another will reduce the within-cluster sum of squares (Hartigan and Wong 1979).

The initial cluster assignment is done by either assigning observations randomly to the \(k\) clusters or by using \(k\) randomly chosen observations as the initial cluster centroids.

Because of this random element, and because the algorithm is not guaranteed to find a global solution, \(K\)-means is typically run with multiple random starts, and the best solution is reported.

Example: \(K\)-Means for Iris Data

To show the basic calculations in \(K\)-means analysis, let’s first look at the familiar Iris data set. We have the luxury of knowing that the data set comprises three species, a \(3\)-means analysis of the flower measurements should be interesting: does it recover the iris species?

The kmeans function in R performs the \(K\)-means analysis. By default, it uses he algorithm of Hartigan and Wong (1979) with a single random start for the initial cluster assignment. Set nstart= to a larger number to increase the number of random starts. Because there are four inputs, Sepal.Length, Sepal.Width. Petal.Length, and Petal.Width, each observation and the centroids live in 4-dimensional space.

set.seed(1234)
iris_s <- scale(iris[,1:4])
km <- kmeans(iris_s,centers=3,nstart=50)

km$size
[1] 50 53 47
km$centers
  Sepal.Length Sepal.Width Petal.Length Petal.Width
1  -1.01119138  0.85041372   -1.3006301  -1.2507035
2  -0.05005221 -0.88042696    0.3465767   0.2805873
3   1.13217737  0.08812645    0.9928284   1.0141287

The algorithm finds three clusters of sizes 50, 53, and 47. The centroid of the first cluster is at coordinate [-1.0112, 0.8504, -1.3006, -1.2507].

The breakdown of the dissimilarities, the squared distances, in the data set is as follows.

km$totss
## [1] 596
km$betweenss
## [1] 457.1116
km$tot.withinss
## [1] 138.8884
km$withinss
## [1] 47.35062 44.08754 47.45019
(km$tot.withinss/km$totss)*100
## [1] 23.30342

The total sum of squares does not depend on the number of clusters. For \(K=3\), it is allocated to 138.8884 sum of squares units within the clusters and 457.1116 between the clusters.

The within-cluster sum of squares measures the average squared Euclidean distance between the points in a cluster and the cluster centroid. We can validate for any of the clusters as follows

withinss <- function(x, center) {
    tmp <- sapply(seq_len(nrow(x)),function(i) sum((x[i,]-center)^2))
    return (sum(tmp))
}
for (i in 1:3) {
    print(withinss(iris_s[km$cluster==i,],km$center[i,]))
}
[1] 47.35062
[1] 44.08754
[1] 47.45019

The distortions of the clusters are obtained by dividing the within-cluster sum of squares with the cluster sizes:

km$withinss / km$size
[1] 0.9470124 0.8318405 1.0095786

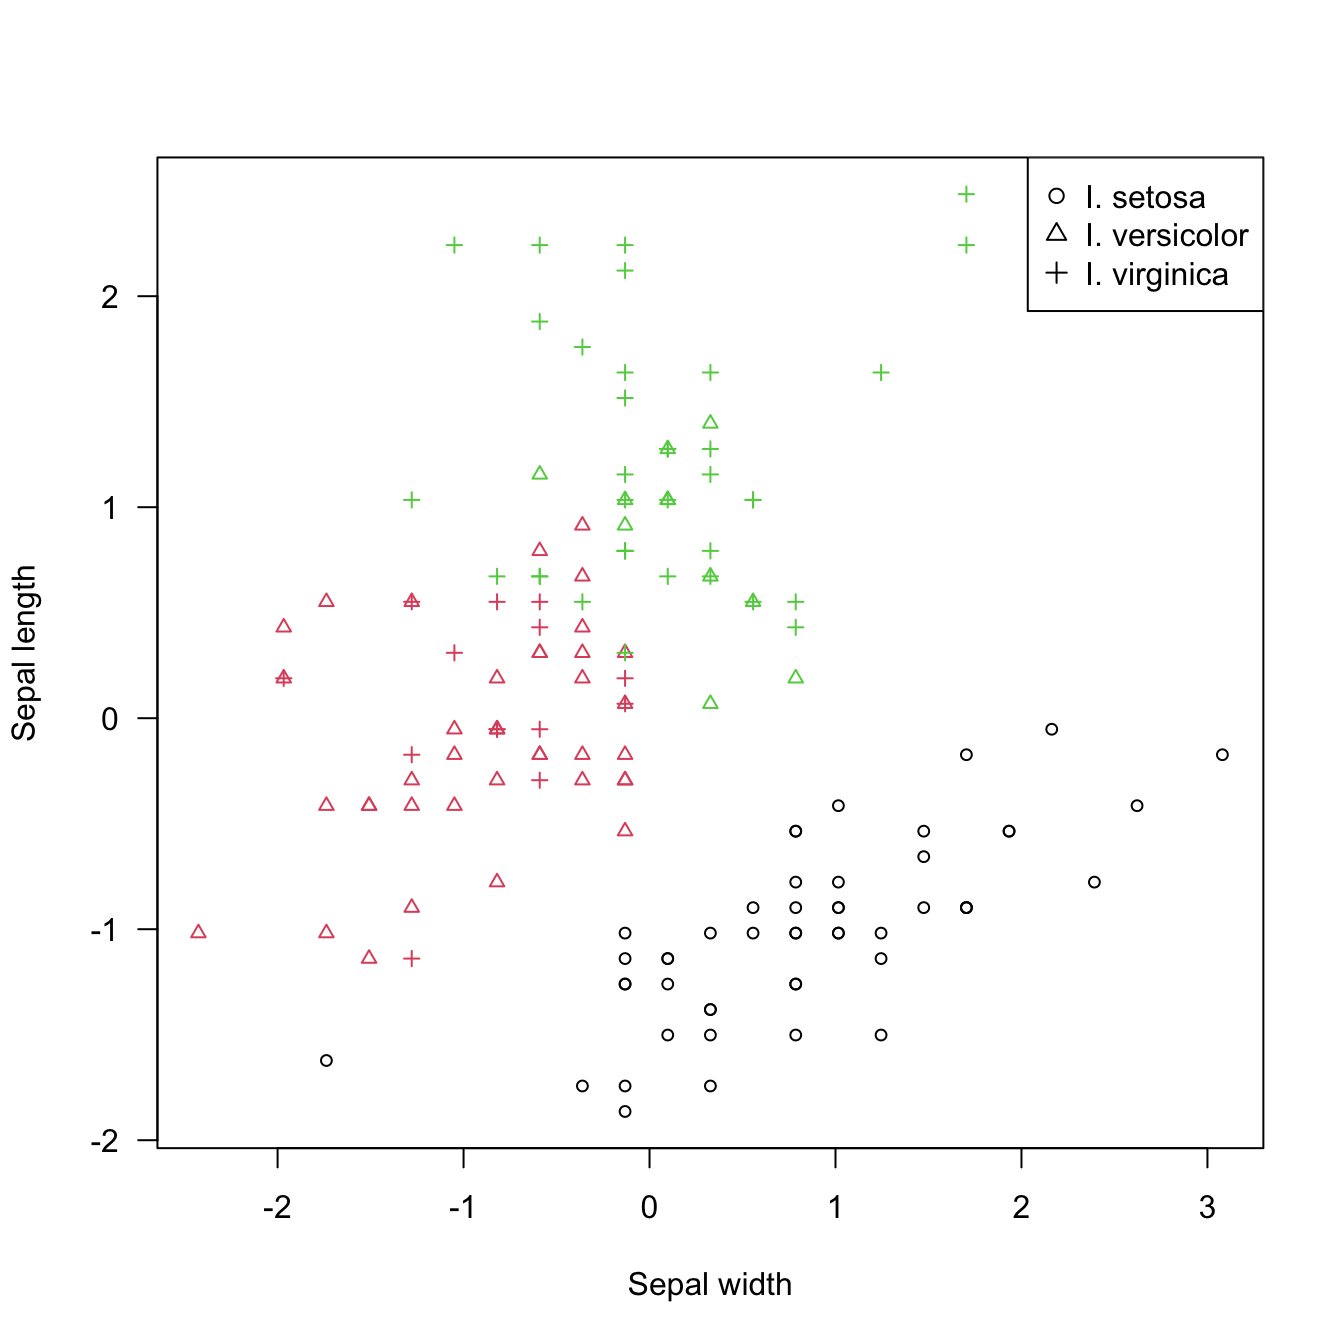
Figure 25.1 shows the cluster assignment in a bivariate plot of two of the flower measurements. The colored cluster symbols are overlaid with the species. The three clusters track the species fairly well, in particular I. setosa. The boundaries of the other two clusters align fairly well with species, but there is considerable overlap.

Figure 25.1: Results of 3-means clustering for Iris data. Clusters are identified through colors, species are identified with plotting symbols.

The separation of these clusters is probably better than Figure 25.1 suggests, because two dimensions (Petal.Width and Petal.Length) are not represented in the figure.

psym <- ifelse(iris$Species=="setosa", 1, 
               ifelse(iris$Species=="versicolor" ,2,3))
cm <- caret::confusionMatrix(as.factor(km$cluster),as.factor(psym))
round(cm$overall,4)
      Accuracy          Kappa  AccuracyLower  AccuracyUpper   AccuracyNull 
        0.8333         0.7500         0.7639         0.8891         0.3333 
AccuracyPValue  McnemarPValue 
        0.0000            NaN 

The confusion matrix between species and cluster assignment has an accuracy of 83.3333%.

Caution

\(K\)-means analysis is generally susceptible to outliers, as they contribute large distances. Also, \(K\)-means analysis is sensitive to perturbations of the data; when observations are added or deleted the results will change. Finally, \(K\)-means is affected by the curse of dimensionality (@#sec-curse-dimensionality).

Clustering Metrics

To choose the appropriate number of clusters in \(K\)-means clustering, we can apply various metrics that measure the tightness of the clusters and their separation. These metrics are plotted against the value of \(k\) in a scree plot. We do not look for a minimum of the criteria, but the “knee” or “elbow” where the increase/decrease of the metric abruptly changes.

The following criteria are commonly computed and plotted.

  • Inertia: this is the within-cluster sum of squares; it measures the tightness of the clusters. It does not necessarily mean that clusters are well separated, it just means that the data points within the clusters are close to their centroid. The within-cluster sum of squares decreases as \(K\) increases, more clusters will lead to less variability within the clusters. In the extreme case when \(k=n\), each observation is a cluster and the within-cluster sum of squares is zero. That is why we do not look for a global minimum with these criteria.

  • Distortion: this is the average inertia within a cluster, obtained by dividing \(\text{SSW}_k\) by the cluster cardinality.

  • Silhouette score: measures how similar a data point is to its own cluster compared to other clusters. While inertia is based on distances of data points from their cluster center, the silhouette takes into account the distances between points in one cluster and the nearest cluster center. The score ranges from \(-1\) to \(+1\); a high silhouette score means that we can easily tell the clusters apart–they are far from each other.

Inertia and silhouette measure different things: the former captures the tightness of the clusters, the latter how far apart (distinguishable) the clusters are. You can have a good (low) inertia but a bad (low) silhouette score if the clusters overlap or sit on top of each other.

Example: Silhouette Scores

You can calculate and/or visualize silhouette scores in R in several ways: using the silhouette function in the cluster library or the fviz_nbclust function in the factoextra package. fviz_nbclust supports additional metrics, for example method="wss" produced a scree plot of the within-cluster sum of squares (inertia).

library(cluster)
set.seed(6345)
silhouette_score <- function(k){
  kmns <- kmeans(iris_s, centers = k, nstart=50)
  ss <- silhouette(kmns$cluster, dist(iris_s))
  mean(ss[, 3])
}
k <- 2:10
plot(k, 
     sapply(k, silhouette_score),
     type='b',
     xlab='Number of clusters', 
     ylab='Average Silhouette Scores',bty="l")

library(factoextra)
fviz_nbclust(iris_s, kmeans, method='silhouette')

fviz_nbclust(iris_s, kmeans, method='wss')

The silhouette scores suggest \(k=2\) and the inertia scree plot \(k\) between 3 and 5.

Predicted Values

Although \(K\)-means is an unsupervised learning method, we can use it to predict the cluster of a new observation. Calculate The distance of the coordinate of the new point to the cluster centers and assign the observation to the cluster whose center is closest. The cluster centroids serve as the predicted values. You can write a function in R that accomplishes that.

If the data were centered and/or scaled in the \(K\)-means analysis, make sure that the same treatment is applied before calculating distances to the cluster centroids.

clusters <- function(x, centers) {
  # compute squared euclidean distance from 
  # each sample to each cluster center
  tmp <- sapply(seq_len(nrow(x)),
                function(i) apply(centers, 1,
                                  function(v) sum((x[i, ]-v)^2)))
  max.col(-t(tmp))  # find index of min distance
}

# two new observations
newx = data.frame("Sepal.Length"=c(4  , 6  ),
                  "Sepal.Width" =c(2  , 3  ),
                  "Petal.Length"=c(1.5, 1.3),
                  "Petal.Width" =c(0.3, 0.5))

#center and scales from training data
means <- attr(iris_s,"scaled:center")
scales <- attr(iris_s,"scaled:scale")
 
pred_clus <- clusters((newx-means)/scales,km$centers)
pred_clus
[1] 1 3
# Using the cluster centers as the predicted values
km$centers[pred_clus,]
  Sepal.Length Sepal.Width Petal.Length Petal.Width
1    -1.011191  0.85041372   -1.3006301   -1.250704
3     1.132177  0.08812645    0.9928284    1.014129

Combining \(K\)-Means and PCA

\(K\)-means analysis finds groups of observations that are similar to each other in the inputs as judged by a distance metric. Principal component analysis finds independent linear combinations of the inputs that explain substantial amounts of information. In the Iris example analyzed earlier, we used 4 input variables but plotted the cluster assignment for two of the variables, because visualization in more dimensions is difficult (Figure 25.1).

There are two ways to combine PCA and \(K\)-means:

  1. PCA after \(K\)-means: Run a \(K\)-means analysis on \(p\) inputs, then calculate the first two principal components with the cluster assignment. This is a visualization techniques for clusters in high-dimensional data. It does not rectify the curse of dimensionality issue from which \(K\)-means suffers as \(p\) gets larger. When applied to visualize data in 2 dimensions, this technique reduces \(p(p-1)/2\) scatterplots to a singple biplot based on the first 2 components.

  2. \(K\)-means after PCA: Use PCA to reduce \(p\) inputs to \(M < p\) principal components, then run a \(K\)-means analysis to find clusters in the components. This approach eliminates the curse of dimensionality.

Example: Airbnb properties in Asheville, NC

The following data is Airbnb data about Asheville, NC. The data for this and other cities is available from http://insideairbnb.com/get-the-data/. We are using six numeric variables for the properties.

library(duckdb)
con <- dbConnect(duckdb(),dbdir = "ads.ddb",read_only=TRUE)
airbnb <- dbGetQuery(con, "SELECT * FROM Asheville")

dbDisconnect(con)
    
airbnb2 <- na.omit(airbnb[,c("price",
    "number_of_reviews","minimum_nights",
    "reviews_per_month","availability_365",
    "calculated_host_listings_count")])

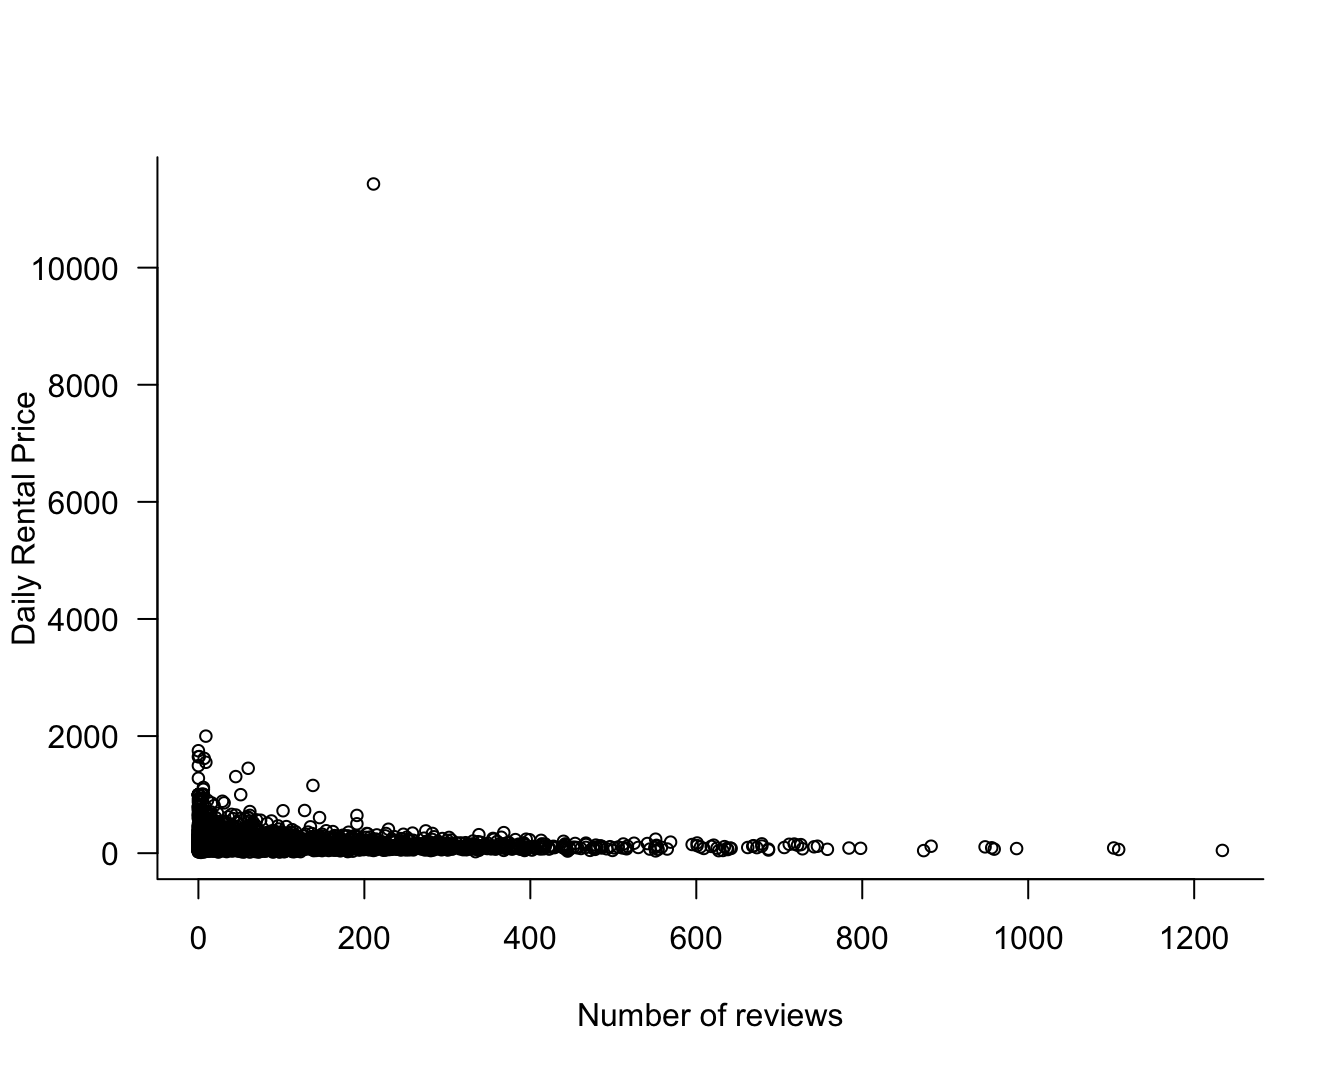
Figure 25.2 shows the distribution of prices as a function of the number of reviews. Many properties have accumulated hundreds of reviews over time. and most are toward the lower end of the price scale.

Figure 25.2

The property with a rental price of more than $10,000 per day is a 1-bedroom, 1-bath guest suite in the middle of Asheville. The rental has a 2-night minimum and over 200 reviews. We are excluding this observation as an outlier.

We now perform a \(K\)-means analysis based on the first two principal components after limiting the data to properties with a daily rental price of less than $2,000.

airbnb2 <- airbnb2[airbnb2$price < 2000,]

pca_asheville <- prcomp(airbnb2,retx=TRUE,scale.=TRUE)
summary(pca_asheville)
Importance of components:
                          PC1    PC2    PC3    PC4    PC5    PC6
Standard deviation     1.3779 1.1772 0.9687 0.8906 0.8262 0.5488
Proportion of Variance 0.3164 0.2310 0.1564 0.1322 0.1138 0.0502
Cumulative Proportion  0.3164 0.5474 0.7038 0.8360 0.9498 1.0000

We use the first three principal components for the subsequent \(K\)-means analysis; they explain 70.383% of variability in the data.

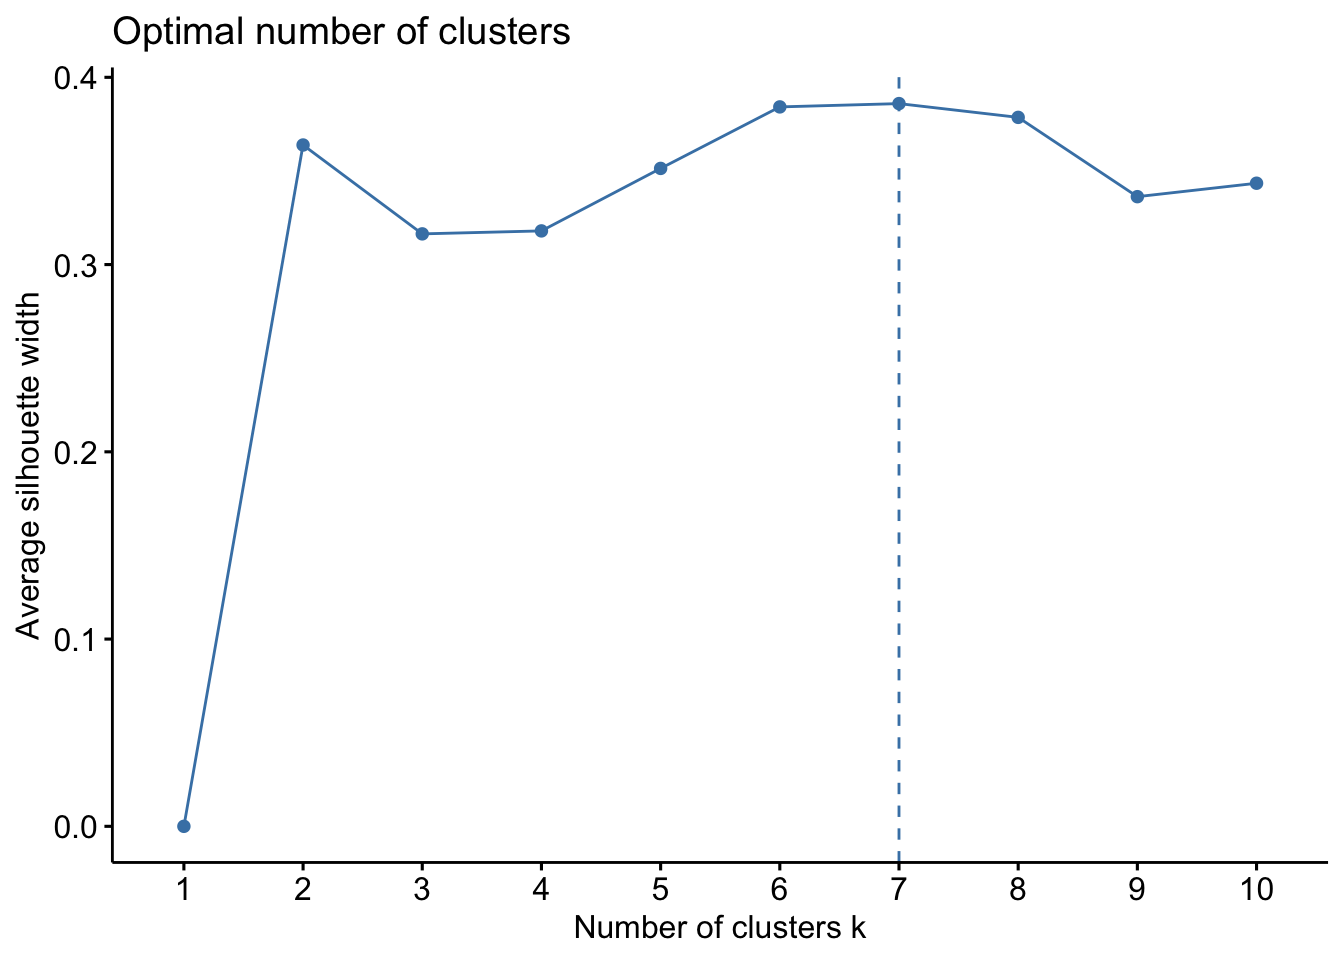
Based on the scree plot of the within-cluster sum of squares and the silhouette scores, \(K\)=5 or \(K=6\) seems like a reasonable number of clusters. The silhouette plot suggests \(K\)=7 instead (Figure 25.3). We compromise on \(K=6\).

fviz_nbclust(pca_asheville$x[,1:3], kmeans, method='silhouette')
Figure 25.3: Silhouette score and inertia scree plot.
fviz_nbclust(pca_asheville$x[,1:3], kmeans, method='wss')

Inertia scree plot.
km <- kmeans(pca_asheville$x[,1:3],centers=6,nstart=25)

library(ggfortify)
autoplot(pca_asheville, 
         data=airbnb2, 
         color=km$cluster, 
         size=0.6,
         loadings.label=TRUE, 
         loadings.label.size = 3,
         loadings=TRUE)

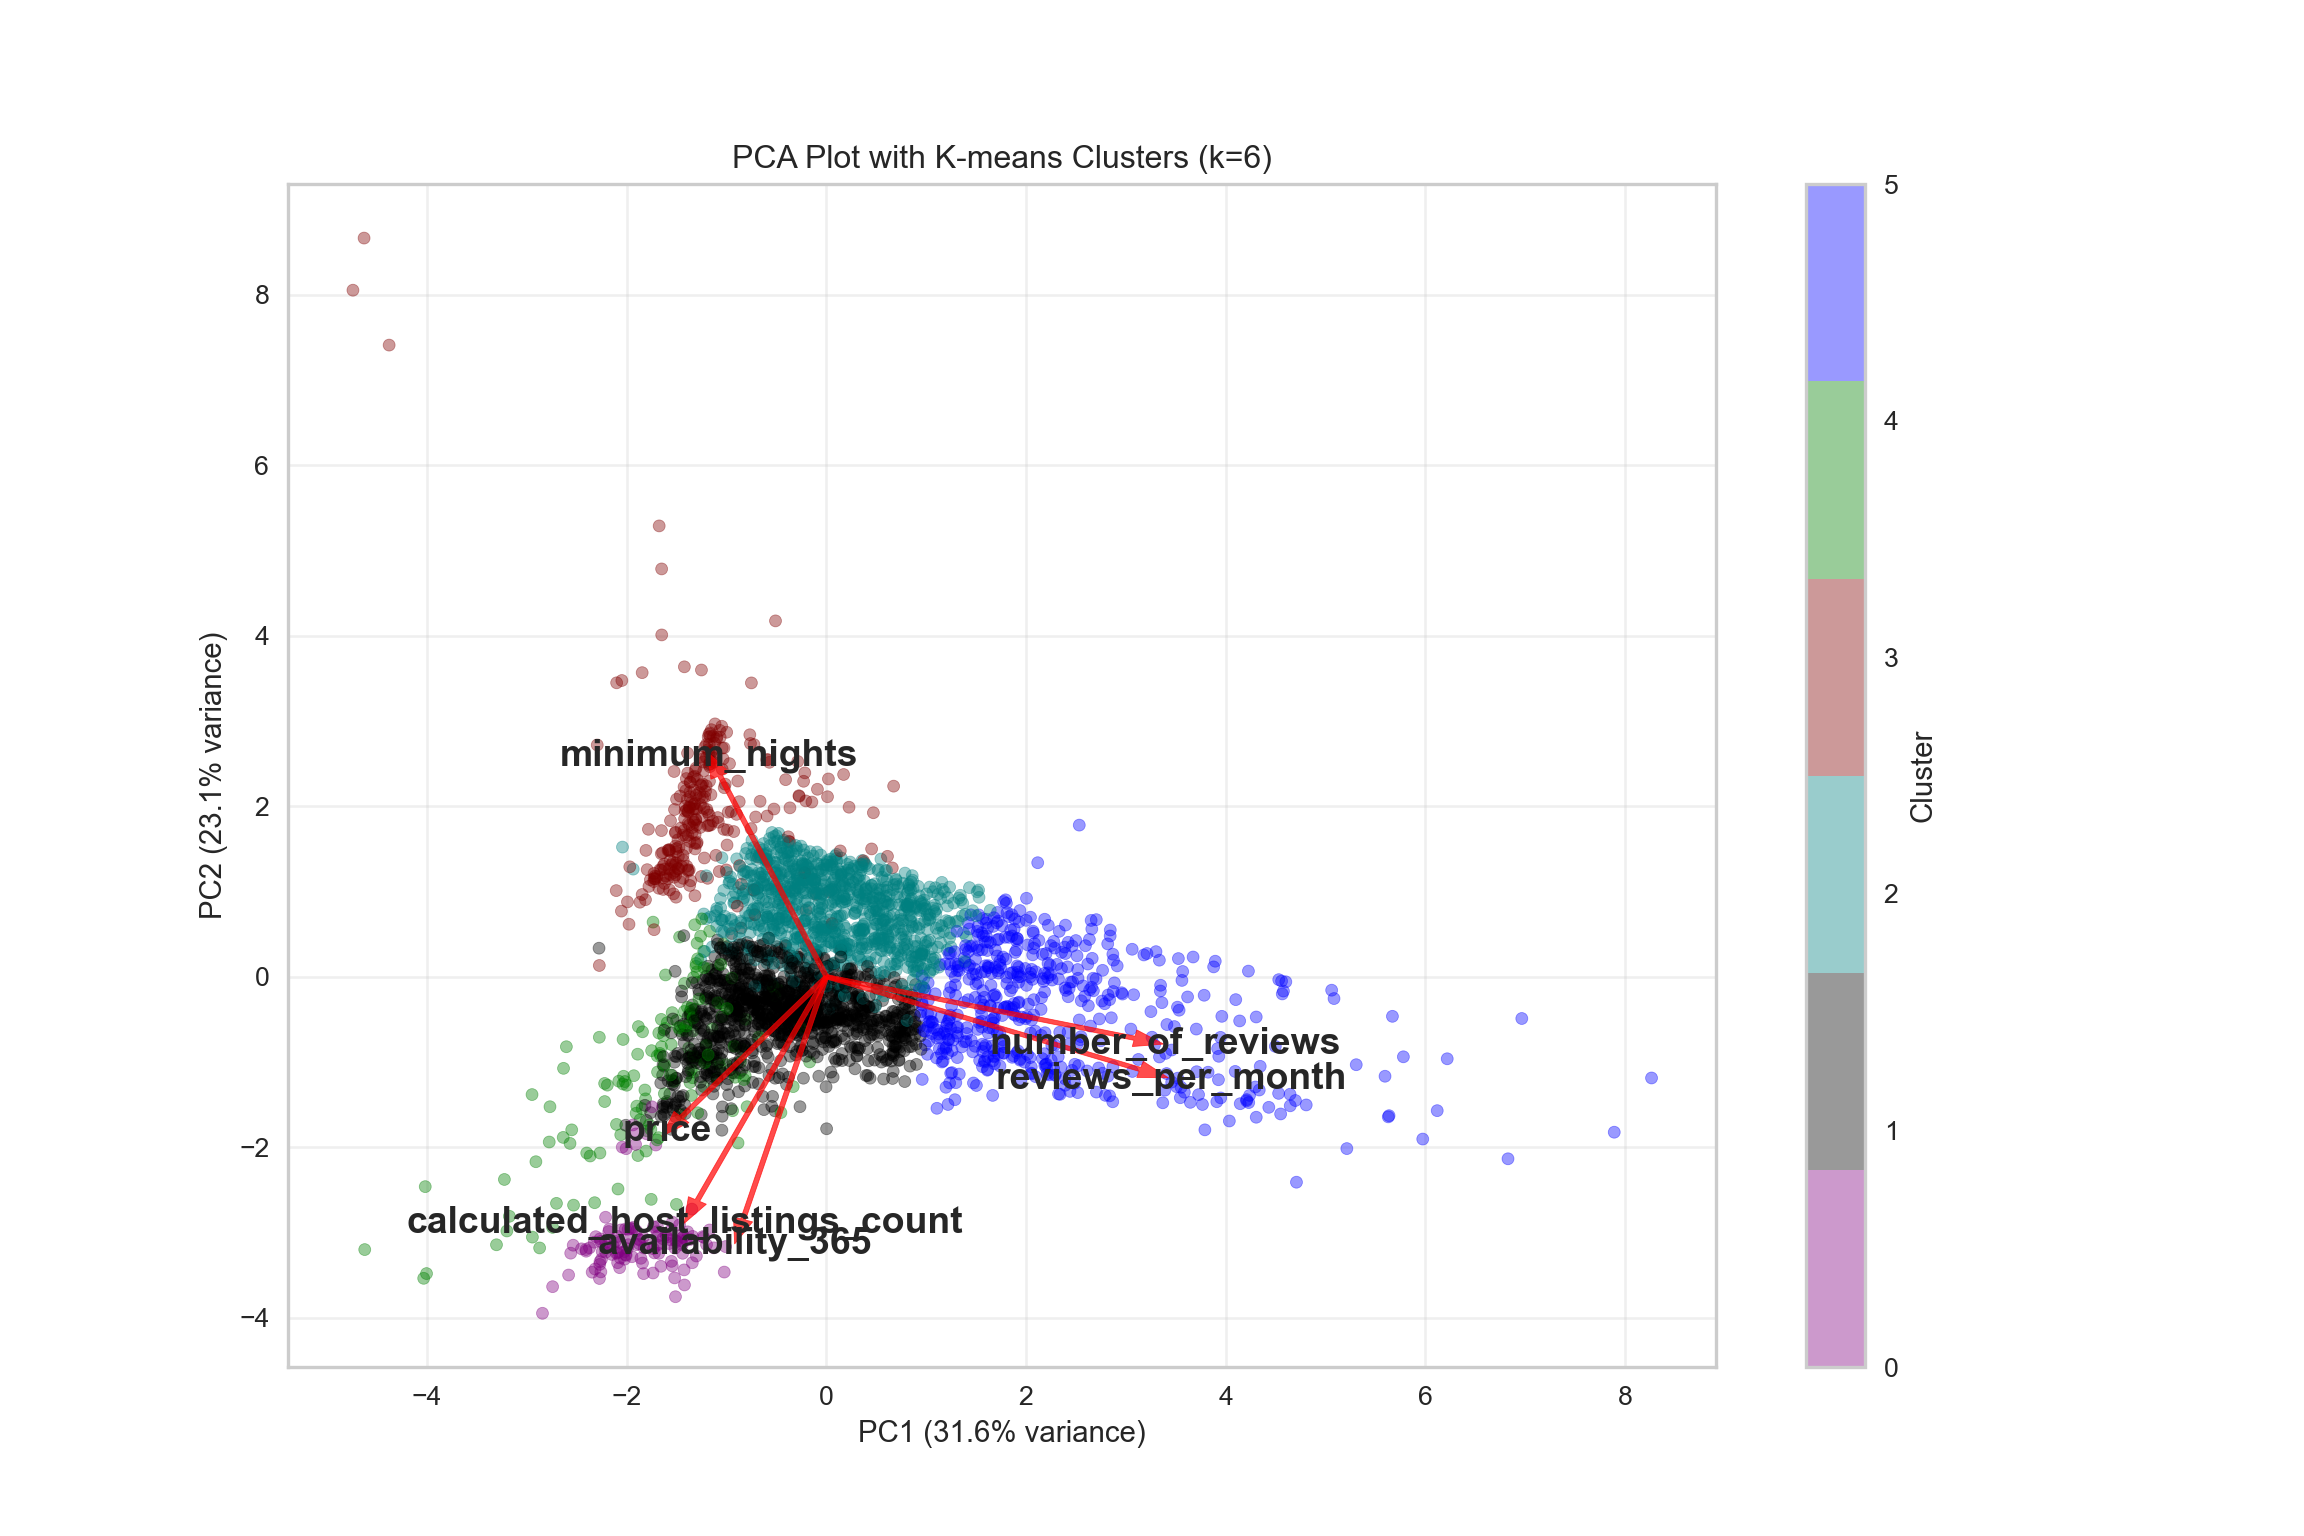
Not surprisingly, the reviews_per_month and the number_of_reviews are highly correlated. The six clusters separate pretty well. There is some overlap between black and green clusters, but the display is missing one of the principal components. The PCA rotation shows that PC1 is dominated by review-related attributes and PC2 by availability of the property and the number of listings that a host has in Asheville. PC3 has negative scores for pricey properties.

pca_asheville$rotation[,1:3]
                                      PC1        PC2         PC3
price                           0.2902296  0.3294264 -0.62170726
number_of_reviews              -0.6172910  0.1445229  0.12113455
minimum_nights                  0.2131000 -0.4718076  0.53510059
reviews_per_month              -0.6282131  0.2176421  0.03637559
availability_365                0.1669516  0.5698854  0.42704350
calculated_host_listings_count  0.2584232  0.5252157  0.35886561

\(K\)-Means on Random Data

Before we leave \(K\)-means clustering, a word of caution. K-Means clustering will always find \(K\) clusters even if the data have no structure. The following data perform a \(3\)-means analysis on 100 observations on 5 inputs drawn randomly from a standard Gaussian distribution. The correlation analysis shows no (pairwise) relationship among the inputs.

set.seed(7654)
x <- matrix(rnorm(500,0,1),nrow=100,ncol=5)
round(cor(x),4)
        [,1]    [,2]    [,3]    [,4]    [,5]
[1,]  1.0000 -0.1803 -0.0074  0.0591  0.0151
[2,] -0.1803  1.0000 -0.1494 -0.0894  0.0121
[3,] -0.0074 -0.1494  1.0000  0.0103 -0.0346
[4,]  0.0591 -0.0894  0.0103  1.0000 -0.0004
[5,]  0.0151  0.0121 -0.0346 -0.0004  1.0000
krand <- kmeans(x,centers=3,nstart=20)
krand$center
        [,1]       [,2]        [,3]       [,4]        [,5]
1 -0.8585193  0.7523440 -0.47938437  0.2871084  0.05588092
2  0.4961648 -0.8522573  0.27922916  1.3559955 -0.03425393
3  0.2284897 -0.3133494  0.05111486 -0.6513347 -0.11558704
krand$withinss
[1]  99.74124  92.39653 149.99366

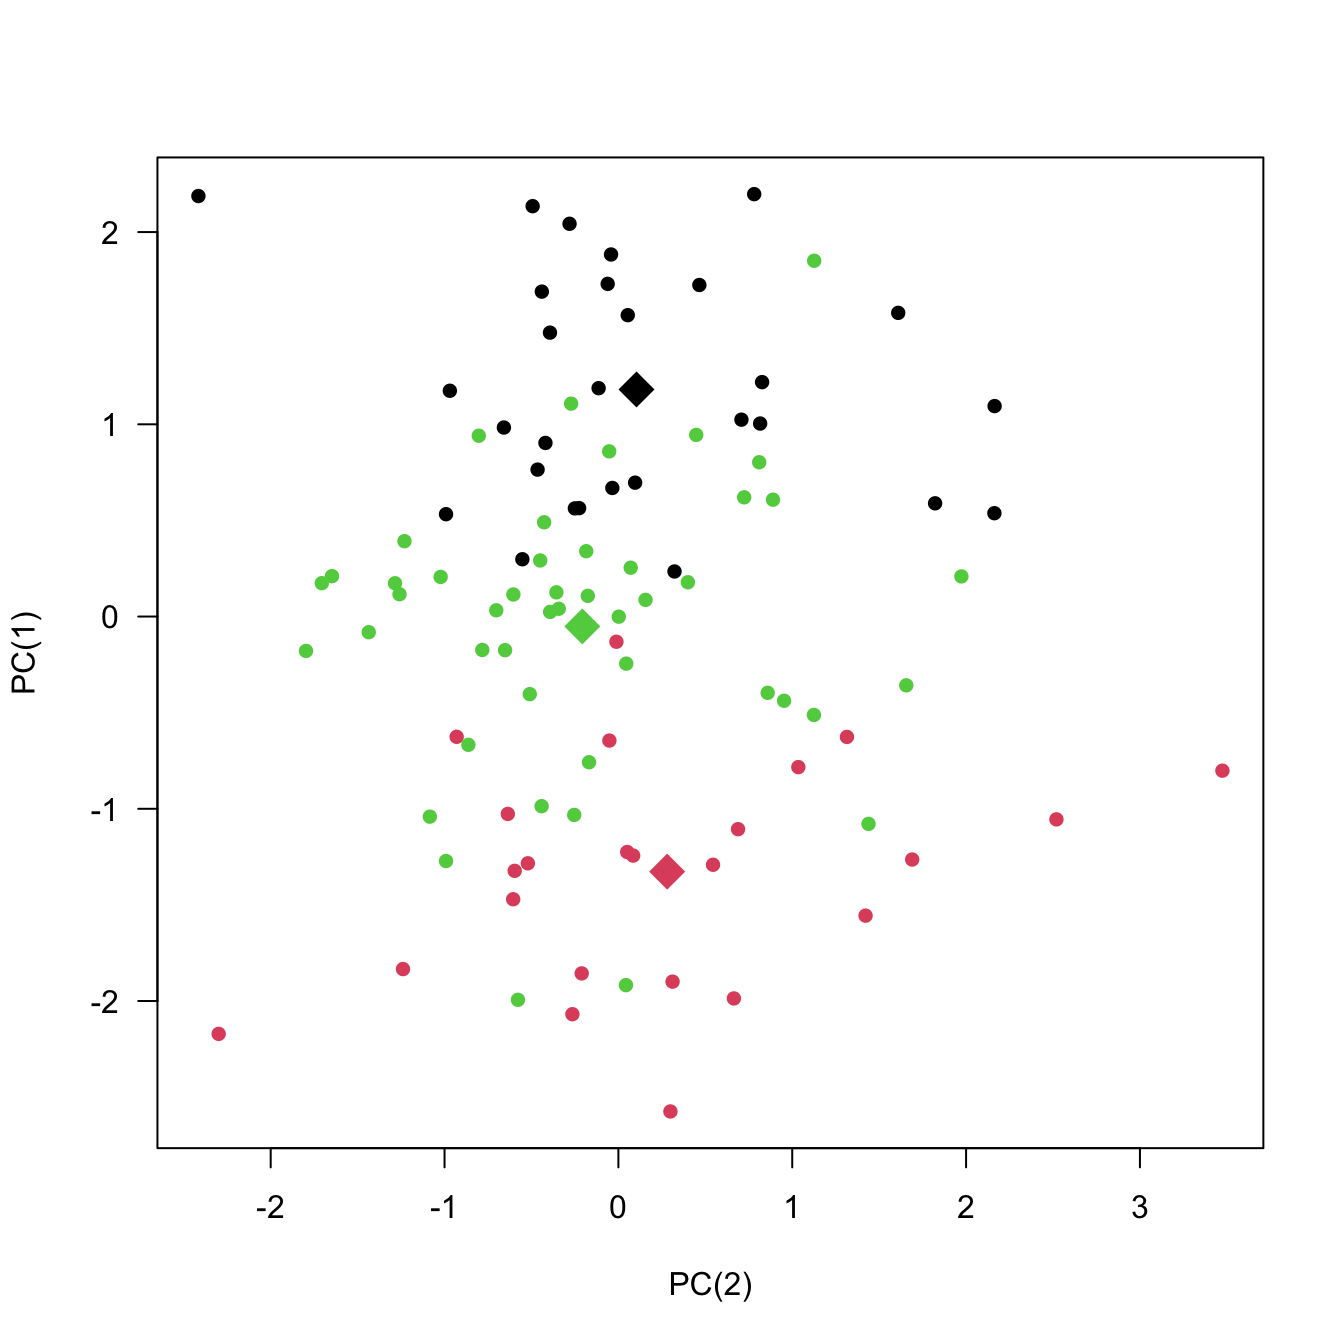
To visualize, run a PCA and color the scores of the first two components with the cluster id. It appears that the algorithm found three somewhat distinct groups of observations. The cluster centroids are certainly quite different (Figure 25.4).

pca <- prcomp(x,scale.=TRUE)
proj_means <- predict(pca,newdata=krand$centers)
Figure 25.4: The first two principal components for \(3\)-means analysis on random data, \(p=5\). The diamonds are the cluster centroids.

There is a clue that something is amiss.

(krand$betweenss/krand$totss)*100
[1] 29.14485

The variability between the clusters accounts for only 29.145% of the variation in the data. If grouping explains differences between the data points, this percentage should be much higher.

25.3 Hierarchical Clustering

Introduction

In \(K\)-means clustering you specify \(K\), find the clusters, and examine the results. Metrics such as inertia, distortion, or the silhouette score are used to find an appropriate value for \(K\). Hierarchical clustering (HC) is a clustering technique where you do not specify the number of clusters in advance. Instead, the entire data set is organized between two extremes:

  • at the top, all observations belong to a single cluster
  • at the bottom, each observations is in a cluster by itself

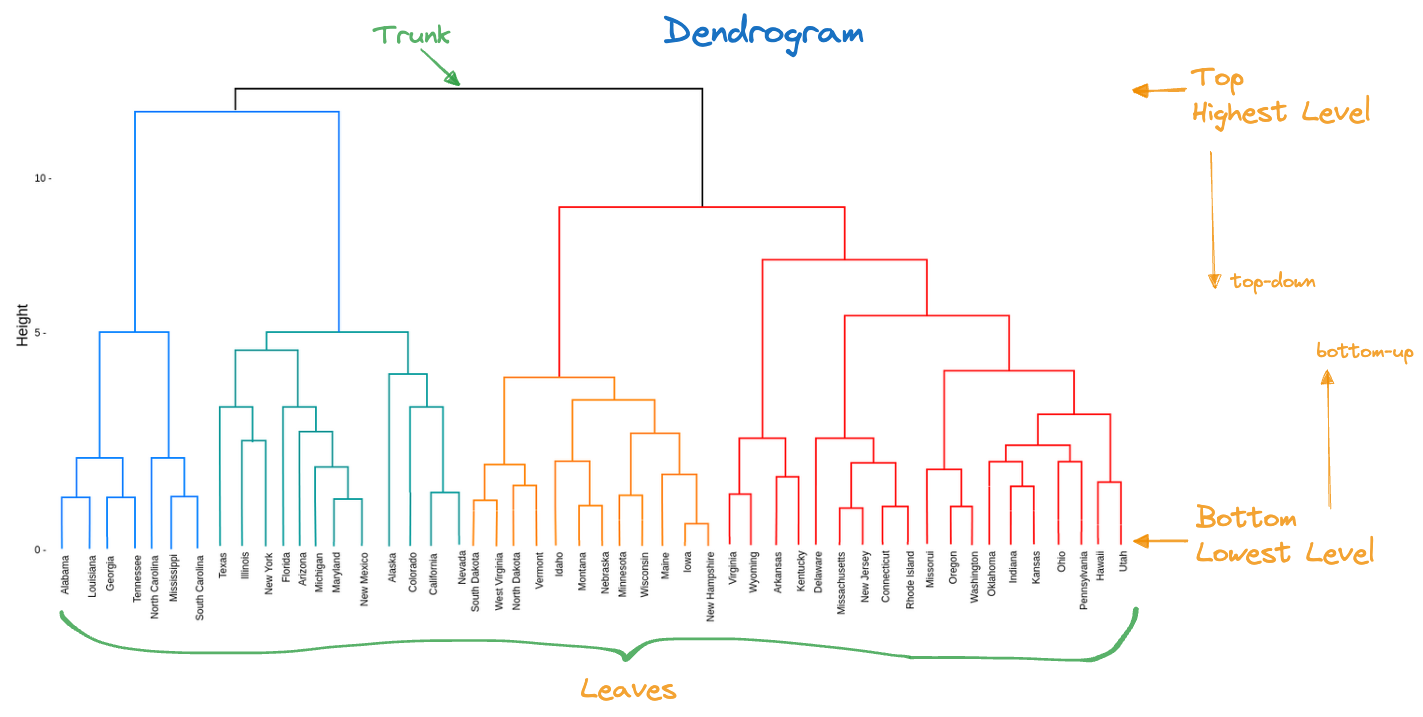
If \(c\) denotes the number of clusters in hierarchical clustering, HC offers you to choose \(1 \le c \le n\). Between the two extremes, \(c=1\) and \(c=n\) lie many configurations where observations are combined into groups based on similarity measures and rules for combining groups, called linkage methods. The choice is typically made based on heuristics such as a visual inspection of the dendrogram, an upside-down tree display of the cluster arrangements (Figure 25.5). Algorithms exist that try to automate and optimize the determination of \(c\) based on criteria such as inertia.

The Dendrogram

Hierarchical clustering is popular because of the dendrogram, an intuitive representation of structure in the data. A word of caution is in order, however: just like \(K\)-means clustering will find \(K\) clusters–whether they exist or not–hierarchical clustering will organize the observations hierarchically in the dendrogram–whether a hierarchy makes sense or not.

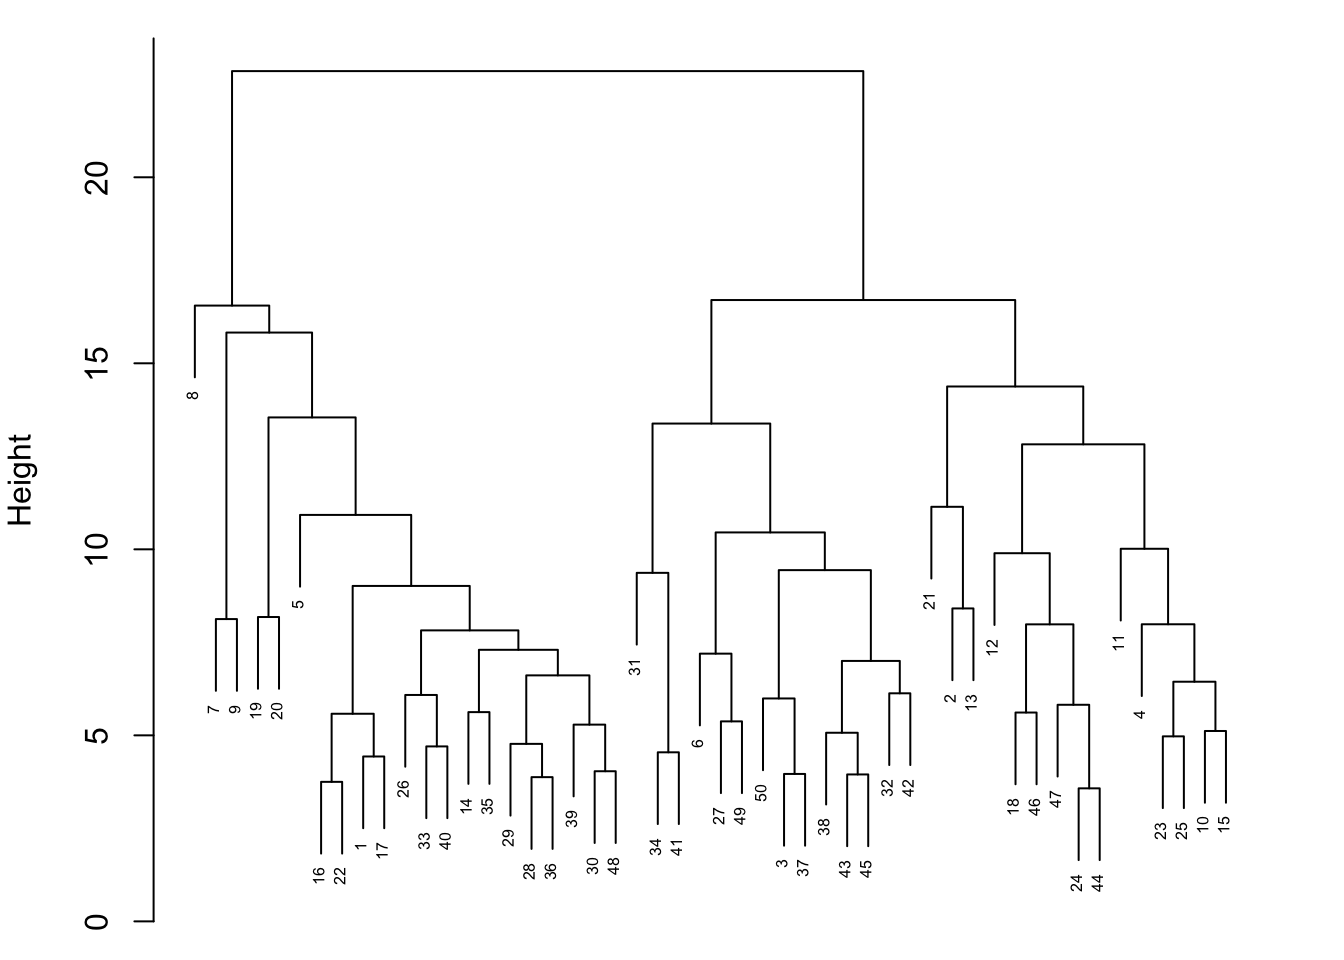
At the lowest level of the dendrogram are the leaves, corresponding to observations. As you move up the tree, those merge into branches. Observations fuse first into groups, later on observations or groups merge with other groups. A common mistake in interpreting dendrograms is to assume similarity is greatest when observations are close to each other on the horizontal axis when fused. Observations are more similar if they are fused lower on the tree. The further up on the tree you go before merging branches, the more dissimilar are the members of the branches.

In Figure 25.6, observations 11 and 4 near the right edge of the tree appear “close” along the horizontal axis. Since they merge much higher up on the tree, these observations are more dissimilar as, for example, observations 23 and 25, which merge early on. Based on where they merge, observation 11 is no more similar to #4 than it is to observations 23, 25, 10, and 15.

Figure 25.6: Example of a dendrogram in hierarchical clustering.

The name hierarchical clustering stems from the fact that clusters lower on the tree (near the bottom) are necessarily contained in clusters higher up on the tree (near the top), since clusters are formed by merging or splitting. This hierarchical arrangement can be unrealistic. James et al. (2021, 523) give the following example

  • Suppose you have data on men and women from three countries.
  • The best division into three groups might be by country.
  • The best division into two groups might be by gender.

The best division into three groups does not result from taking the two gender groups and splitting one of those.

There are two general approaches to construct a dendrogram.

  • The agglomerative (bottom-up) approach starts with \(c=n\) clusters at the bottom of the dendrogram, where each observation is a separate cluster, and merges observations and branches based on their similarity. The pair chosen for merging at any stage consists of the least dissimilar (most similar) groups.

  • The divisive (top-down) approach starts at the trunk (the top) of the tree with a single cluster that contains all observations. Moving down the tree, branches are split into clusters to produce groups with the largest between-group dissimilarity (least similar clusters).

Cutting the Dendrogram

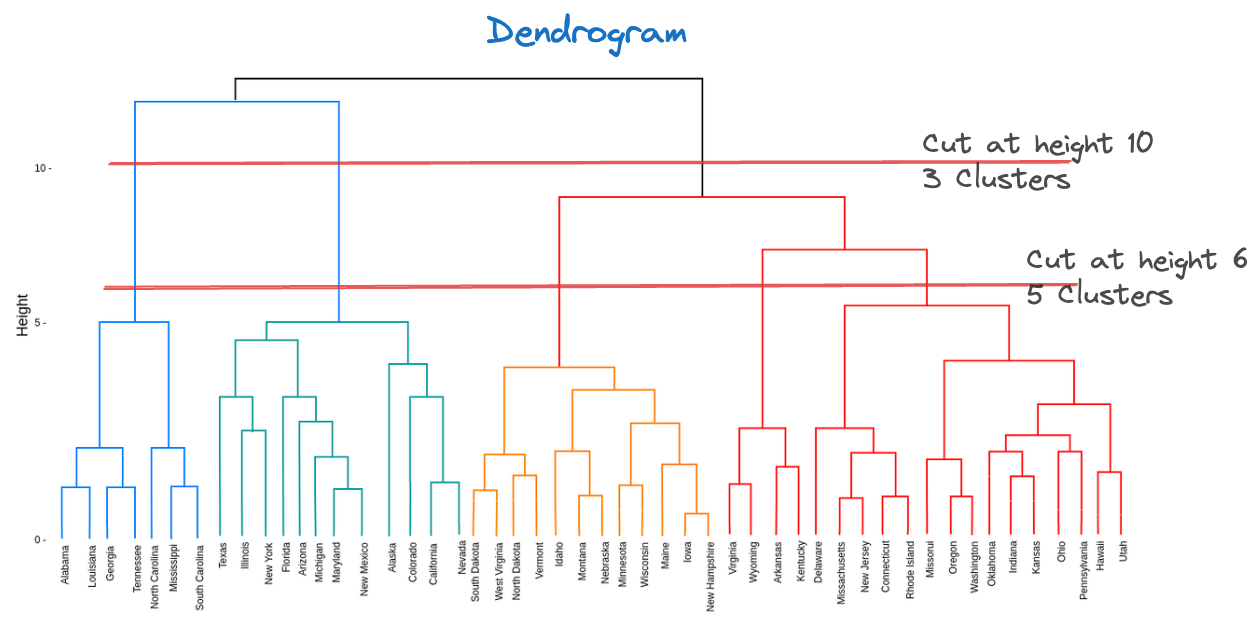
It is best to interpret the dendrogram as a data summary, not as a confirmatory tool. Based on the dendrogram you can choose any number of clusters. The typical approach is called cutting the tree, whereby you choose a particular height on the dendrogram and draw a line across. Depending on where you draw the line you end up with a different number of clusters (Figure 25.7). The number of clusters corresponds to the number of vertical lines the cut intersects.

Dissimilarity and Linkage

Before we can construct a dendrogram, we need to decide on two more things (besides whether the approach is top-down or bottom-up): a measure of dissimilarity and a rule on which groups are to be merged. These choices have profound effect on the resulting dendrogram, more so than the choice between top-down or bottom-up approach.

Dissimilarity measures

Let \(x_{ij}\) denote the measurements for \(i=1,\cdots, n\) observations on \(j=1,\cdots, p\) inputs (variables). As before, the vector of inputs for the \(i\)th observation is denoted \(\textbf{x}_i = [x_{i1},\cdots, x_{ip}]\).

The dissimilarity (distance) matrix \(\textbf{D}\) for the data is an \((n \times n)\) matrix with typical element \[ D(\textbf{x}_i,\textbf{x}_{i^\prime}) = \sum_{j=1}^p w_j \, d_j(x_{ij},x_{i^\prime j}) \] The \(w_j\) are weights associated with the \(j\)th attribute, \(\sum_{j=1}^p w_j = 1\). \(d_j(x_{ij},x_{i^\prime j})\) measures the dissimilarity between any two observations for the \(j\)th attribute.

A number of dissimilarity measures are used, depending on the type of variable and the application. For quantitative variables, the following are most popular:

  • Squared Euclidean distance \[d_j(x_{ij},x_{i^\prime j}) = (x_{ij} - x_{i^\prime j})^2\] A frequent choice, but it is sensitive to large distances due to squaring.

  • Euclidean distance \[ D(\textbf{x}_i,\textbf{x}_{i^\prime}) = \sqrt{ \sum_{j=1}^p (x_{ij} - x_{i^\prime j})^2} \] This is the usual distance (\(L_2\)-norm) between two vectors \(\textbf{x}_i\) and \(\textbf{x}_{i^\prime}\). Taking the square root expresses the distance in the same units as the \(X\)s.

  • Absolute distance, also called “Manhattan” or city-block distance \[ d_j(x_{ij},x_{i^\prime j}) = |x_{ij} - x_{i^\prime j}| \] Absolute distance is more robust to large differences compared to dissimilarity based on (squared) Euclidean distance.

  • Correlation-based distance \[ d_j(x_{ij},x_{i^\prime j}) = 1- \rho(\textbf{x}_i,\textbf{x}_{i^\prime}) = 1- \frac{\sum_j (x_{ij}-\overline{x}_i) (x_{i^\prime j} - \overline{x}_{i^\prime})} {\sqrt{\sum_j (x_{ij}-\overline{x}_i)^2 \, (x_{i^\prime j} - \overline{x}_{i^\prime})^2 }} \] with \(\overline{x}_i = 1/p \sum_j x_{ij}\).

Note

Note that \(\rho(\textbf{x}_i, \textbf{x}_{i^\prime})\) does not measure the correlation between two variables across a set of \(n\) observations–that would be the familiar way to calculate and interpret a correlation coefficient. \(\rho(\textbf{x}_i, \textbf{x}_{i^\prime})\) is the correlation between two observations across \(p\) attributes.

Example: Effect of Distance Metrics

We use a simple data set with observations on the shopping behavior of four imaginary shoppers. Frank, Betsy, Julian, and Lisa make purchases of 5 possible items. The values for the item attributes are the number of times the item was purchased.

df <- data.frame(shopper=c("Frank","Besty","Julian","Lisa"),
                 item1=c(0,1,0,0),
                 item2=c(0,0,4,1),
                 item3=c(1,1,0,0),
                 item4=c(1,3,0,1),
                 item5=c(2,0,1,1)
                 )
df
  shopper item1 item2 item3 item4 item5
1   Frank     0     0     1     1     2
2   Besty     1     0     1     3     0
3  Julian     0     4     0     0     1
4    Lisa     0     1     0     1     1

First, let’s calculate various distance metrics. These are represented as matrices of distances between the data points. The function dist() returns the lower triangular matrix of pairwise distances

dist(df[,2:6],method="manhattan")
##    1  2  3
## 2  5      
## 3  7 10   
## 4  3  6  4
dist(df[,2:6],method="euclidean")
##          1        2        3
## 2 3.000000                  
## 3 4.358899 5.291503         
## 4 1.732051 2.828427 3.162278

The dist function excludes the diagonal entries of the distance matrix by default, these are known to be zero. Because the input values are integers in this example, the city-block distances are also integers.

The correlation-based distances can be calculated with factoextra::get_dist(). This function adds methods for correlations based on Pearson (method="pearson"), Spearman (method="spearman") or Kendall (method="kendall"). The variables can be centered and scaled with stand=TRUE (stand=FALSE is the default).

cor(t(df[,2:6]))
           [,1]       [,2]       [,3]      [,4]
[1,]  1.0000000  0.0000000 -0.3450328 0.3273268
[2,]  0.0000000  1.0000000 -0.5892557 0.0000000
[3,] -0.3450328 -0.5892557  1.0000000 0.5270463
[4,]  0.3273268  0.0000000  0.5270463 1.0000000
get_dist(df[,2:6],method="pearson",stand=FALSE)
          1         2         3
2 1.0000000                    
3 1.3450328 1.5892557          
4 0.6726732 1.0000000 0.4729537

The correlation-based dissimilarity is not equal to the correlation among the item purchases, it is one minus the correlation of the item purchases for each shopper.

The cluster::daisy() function can compute Euclidean, Manhattan, and Gower’s distance matrices. More on Gower’s distance after the example.

daisy(df[,2:6],metric="manhattan")
## Dissimilarities :
##    1  2  3
## 2  5      
## 3  7 10   
## 4  3  6  4
## 
## Metric :  manhattan 
## Number of objects : 4
daisy(df[,2:6],metric="euclidean")
## Dissimilarities :
##          1        2        3
## 2 3.000000                  
## 3 4.358899 5.291503         
## 4 1.732051 2.828427 3.162278
## 
## Metric :  euclidean 
## Number of objects : 4
daisy(df[,2:6],metric="gower")
## Dissimilarities :
##           1         2         3
## 2 0.5333333                    
## 3 0.5666667 0.9000000          
## 4 0.3500000 0.6833333 0.2166667
## 
## Metric :  mixed ;  Types = I, I, I, I, I 
## Number of objects : 4

Now let’s construct the dendrograms for the data based on Euclidean and Pearson correlation distance matrices using the hclust function. The input to hclust is a distance (dissimilarity) matrix as produced by dist(), get_dist(), daisy(). The actual values of the variables are no longer needed once the dissimilarities are calculated.

h1 <- hclust(dist(df[,2:6]))
h2 <- hclust(get_dist(df[,2:6],method="pearson"))

par(mfrow=c(1,2))
par(cex=0.7) 
par(mai=c(0.6,0.6,0.2,0.3))
plot(h1,labels=df[,1],sub="",xlab="Shoppers",main="Euclidean Dist.")
plot(h2,labels=df[,1],sub="",xlab="Shoppers",main="Correlation")

Choosing Euclidean distance groups together users who bought few items, because they appear as similar (close). Frank and Lisa bought 4 and 3 items, respectively. Betsy and Julian purchased 5 items. Choosing correlation-based distance groups users who bought items together. For example, Julian and Lisa bought items 2 and 5 together, Frank and Betsy purchased items 3 and 4 together.

The distance metrics discussed so far are not appropriate for categorical variables (nominal or ordinal) because differences between values are not defined. A four-star rating is not twice as much as a two-star rating and the “distance” between a one- and two-star rating is not the same as that between a four- and five-star rating.

Still, for an ordinal variable with \(M\) categories it is not uncommon to replace the label for category \(j\) with \[ \frac{j-1/2}{M} \] and treat this as a quantitative score. With nominal variables it is common to assign a simple loss value depending on whether the values of two variables are the same (loss = 0) or different (loss=1).

What should we do when the inputs are of mixed type, for example, \(x_1\) is continuous, \(x_2\) is binary, and \(x_3\) is nominal? Gower (n.d.) introduced a similarity metric to compute distances in this case, known as Gower’s distance. Suppose there are no missing values. Gower’s similarity coefficient is \[ S(\textbf{x}_i,\textbf{x}_{i^\prime}) = \frac{1}{p}\sum_{j=1}^p s_{ii^\prime j} \] The \(s_{ii^\prime j}\) is the score between observations \(i\) and \(i^\prime\) for variable \(j\); The scores range \(0 \leq s_{ii^\prime j} \leq 1\) and are calculated as follows:

  • qualitative attributes: 0/1 loss

  • quantitative attritbutes: \[ s_{i i^\prime j} = 1 - \frac{x_{ij} - x_{i^\prime j}}{R_j} \] where \(R_j\) is the range (max-min) for the \(j\)th variable. The Gower similarity coefficient has the following properties:

  • \(0 \leq S(\textbf{x}_i, \textbf{x}_{i^\prime}) \leq 1\)

  • \(S(\textbf{x}_i, \textbf{x}_{i^\prime}) = 0 \Rightarrow\) records differ maximally

  • \(S(\textbf{x}_i, \textbf{x}_{i^\prime}) = 1 \Rightarrow\) records do not differ

For purposes of clustering, the dissimilarity measure based on Gower’s distance is \(1 - S(\textbf{x}_i, \textbf{x}_{i^\prime})\). This is implemented in the daisy function of the cluster package in R.

Linkage methods

\(D(\textbf{x}_i,\textbf{x}_{i^\prime})\) measures the dissimilarity between two data points. In order to move up (or down) the tree in hierarchical clustering we also need to determine how to measure the similarity/dissimilarity between groups of points. Suppose \(G\) and \(H\) present two clusters and \(D(G,H)\) is the dissimilarity between the two, some function of the dissimilarity of the points in the clusters. The decision rule that determines how to merge (or split) clusters is called linkage. The three most common linkage methods are

  • Single linkage: \(D(G,H) = \min D(\textbf{x}_i,\textbf{x}_{i^\prime}), i \in G, i^\prime \in H\)

  • Complete linkage: \(D(G,H) = \max D(\textbf{x}_i,\textbf{x}_{i^\prime}), i \in G, i^\prime \in H\)

  • Average linkage: \(D(G,H) = \text{ave} D(\textbf{x}_i,\textbf{x}_{i^\prime}), i \in G, i^\prime \in H\)

The agglomerative clustering algorithm merges the clusters with the smallest linkage value.

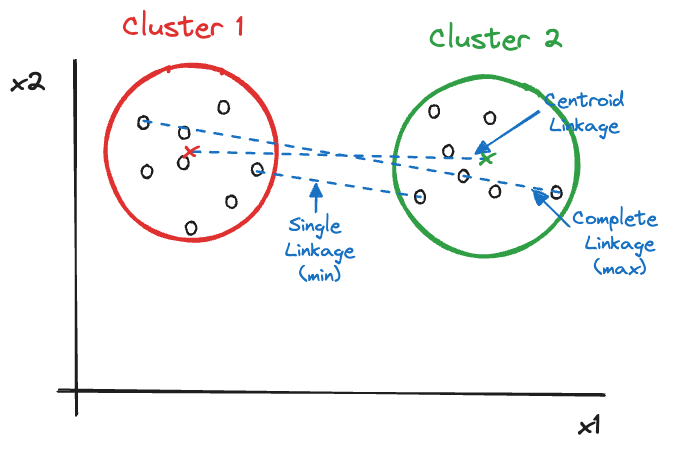
When clusters separate well, the choice of linkage is not that important. Otherwise, linkage can have substantial impact on the outcome of hierarchical clustering. Single linkage is known to cause chaining, combining observations that are linked by a series of close observations. Complete linkage tends to produce compact clusters, but observations can end up being closer to members of other clusters than to members of their own cluster. Average linkage is a compromise, but is not invariant to transformations of the dissimilarities. Centroid linkage uses distances between centroids of the clusters (Figure 25.8).

Example: Hierarchical Cluster Analysis for Glaucoma Data.

What can we learn about the 98 subjects in the Glaucoma data set who had glaucomatous eyes by way of hierarchical cluster analysis? The following statements create a data frame from the DuckDB table, filter the glaucotamous cases, remove Glaucoma column and scale the remaining 62 variables.

library(duckdb)
library(dplyr)
con <- dbConnect(duckdb(),dbdir = "ads.ddb",read_only=TRUE)
glauc <- dbGetQuery(con, "SELECT * FROM Glaucoma")

dbDisconnect(con)

glauc <- glauc %>% filter(Glaucoma==1) %>% 
    dplyr::select(-c(Glaucoma)) %>% 
    scale()

We first perform agglomerative clustering with correlation-based dissimilarity and complete linkage.

hc <- hclust(get_dist(glauc,method="pearson"),method="complete")

The merge matrix on the hclust output object describes the \(n-1\) steps in which the observations/clusters were merged. Negative numbers refer to observations, positive numbers refer to clusters formed at that stage.

hc$merge[1:25,]
      [,1] [,2]
 [1,]  -34  -41
 [2,]   -4  -73
 [3,]  -16  -95
 [4,]  -58  -93
 [5,]  -72  -90
 [6,]  -24  -70
 [7,]  -76    1
 [8,]   -6  -75
 [9,]  -51    2
[10,]  -43  -45
[11,]  -27  -55
[12,]   -9  -79
[13,]  -20  -65
[14,]  -19  -56
[15,]  -15  -71
[16,]  -29  -81
[17,]   -7   12
[18,]  -30  -57
[19,]  -17  -54
[20,]  -23  -25
[21,]  -80    7
[22,]  -61  -68
[23,]    4    5
[24,]    3   14
[25,]  -13  -60

The first merge combines observations #34 and #41 into a group of two. The next merge combines #4 and #73 into another group of two. At the seventh merge, observation #76 is combined with the group created at the first merge. This cluster now contains observations [34, 41, 76]. The first time two groups are being merged is at step 23: the groups consisting of observations [58, 93] and [72, 90] are combined into a cluster of 4.

The height vector is a vector of \(n-1\) values of the height criterion; the actual values depend on the linkage method. For this analysis, the first 25 heights at which merges occurred are as follows:

hc$height[1:25]
 [1] 0.1022034 0.1031823 0.1144513 0.1331928 0.1349688 0.1386951 0.1487625
 [8] 0.1510436 0.1540351 0.1547025 0.1657972 0.1679269 0.1770342 0.1806037
[15] 0.1838289 0.1868672 0.2097274 0.2276110 0.2467682 0.2477665 0.2543348
[22] 0.2682308 0.2684616 0.2737816 0.2779692

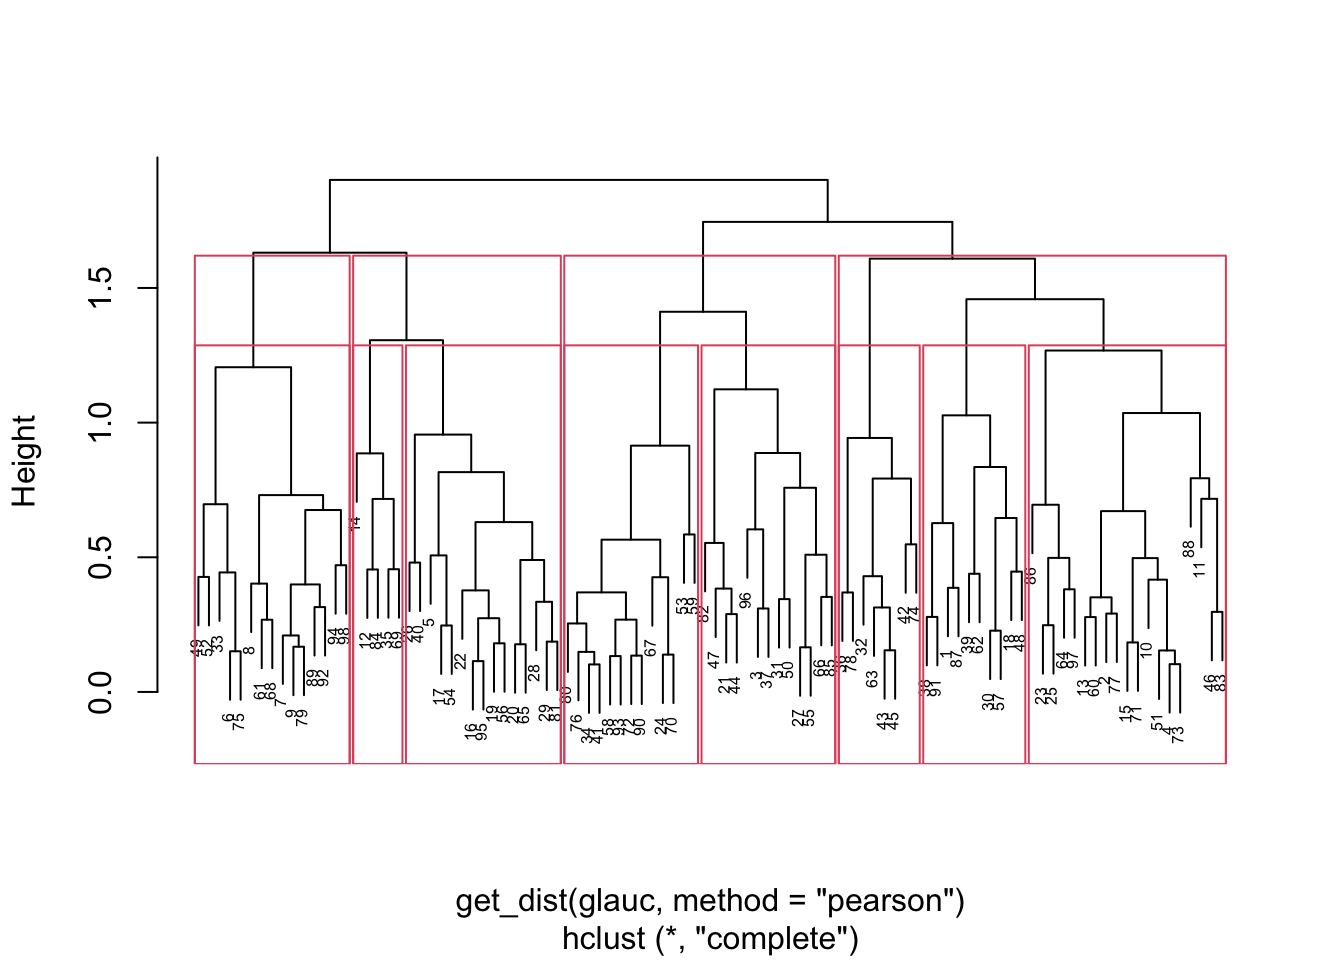
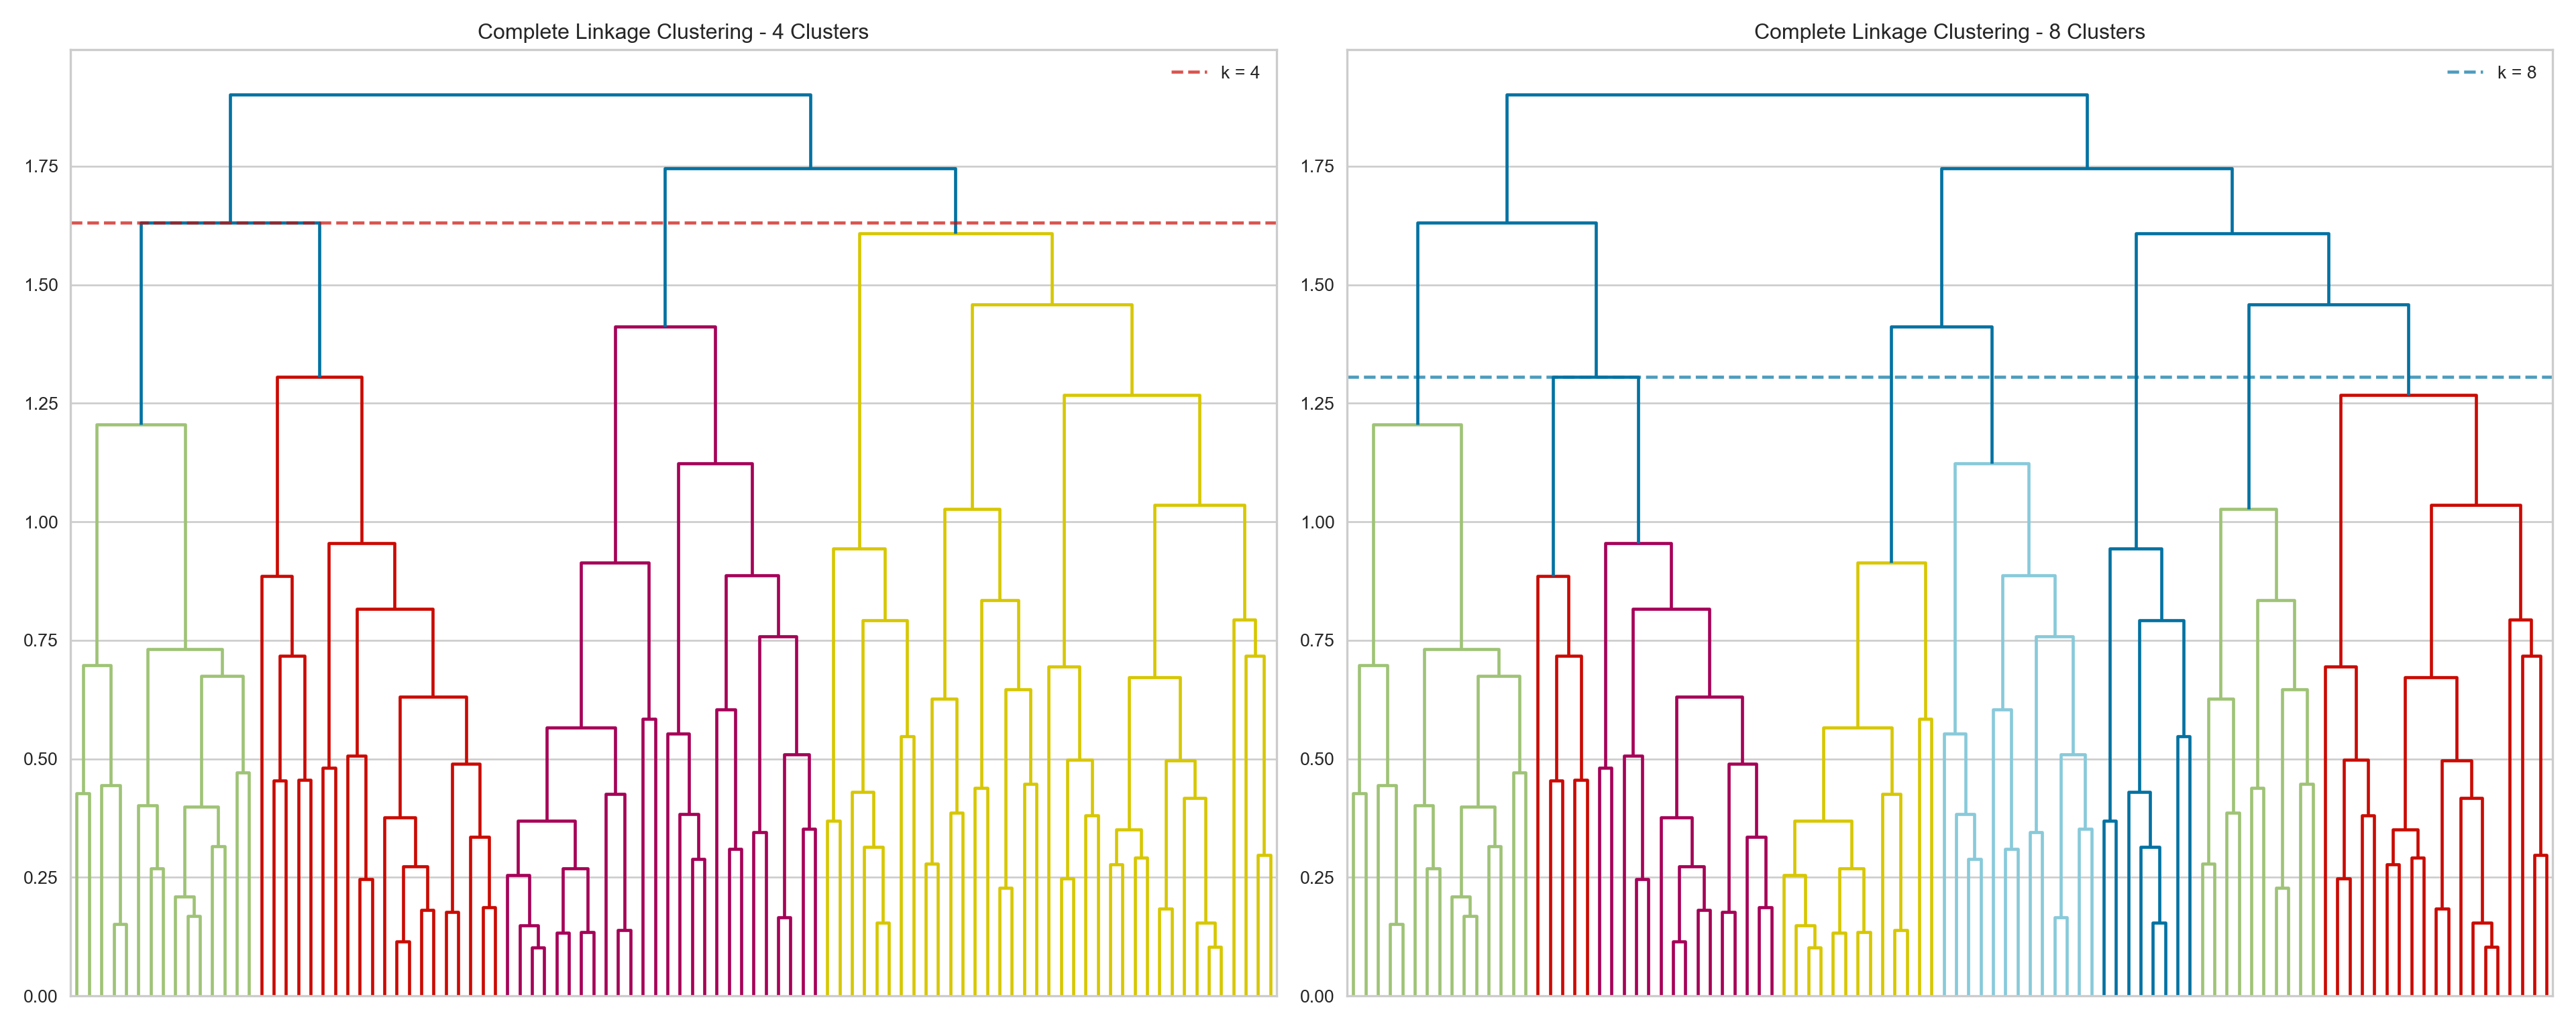
The dendrogram for this analysis is plotted in Figure 25.9 along with the bounding boxes for 4 and 8 clusters. The cut for the larger number of clusters occurs lower at the tree.

plot(hc, cex=0.5, main="",)
rect.hclust(hc,k=4)
rect.hclust(hc,k=8)
Figure 25.9: Dendrogram for partial glaucoma data with correlation-based dissimilarity and complete linkage.

The sizes of the four clusters are as follows:

table(cutree(hc,k=4))

 1  2  3  4 
37 26 20 15 

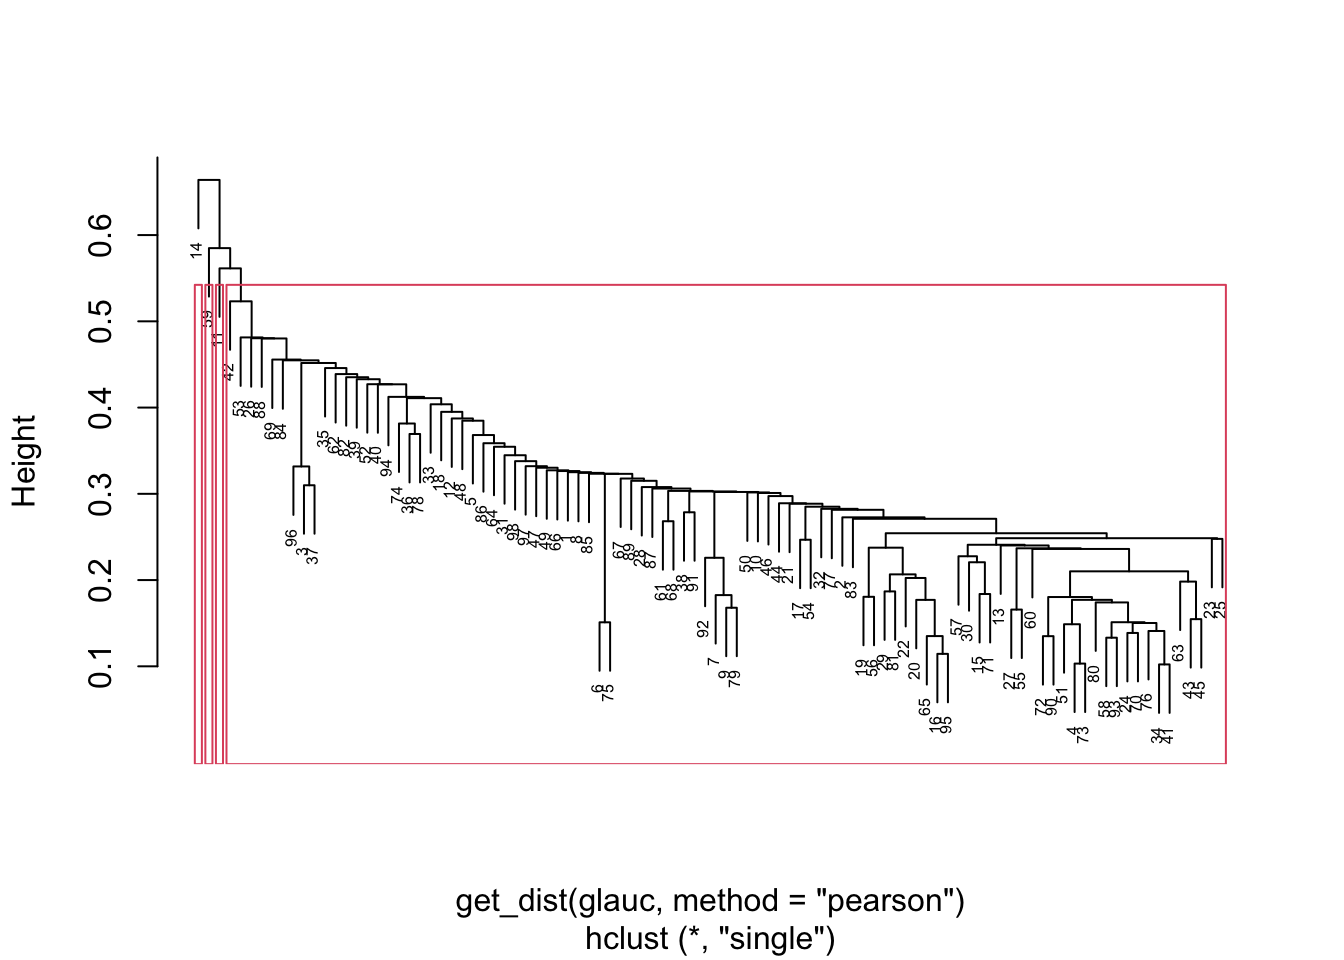
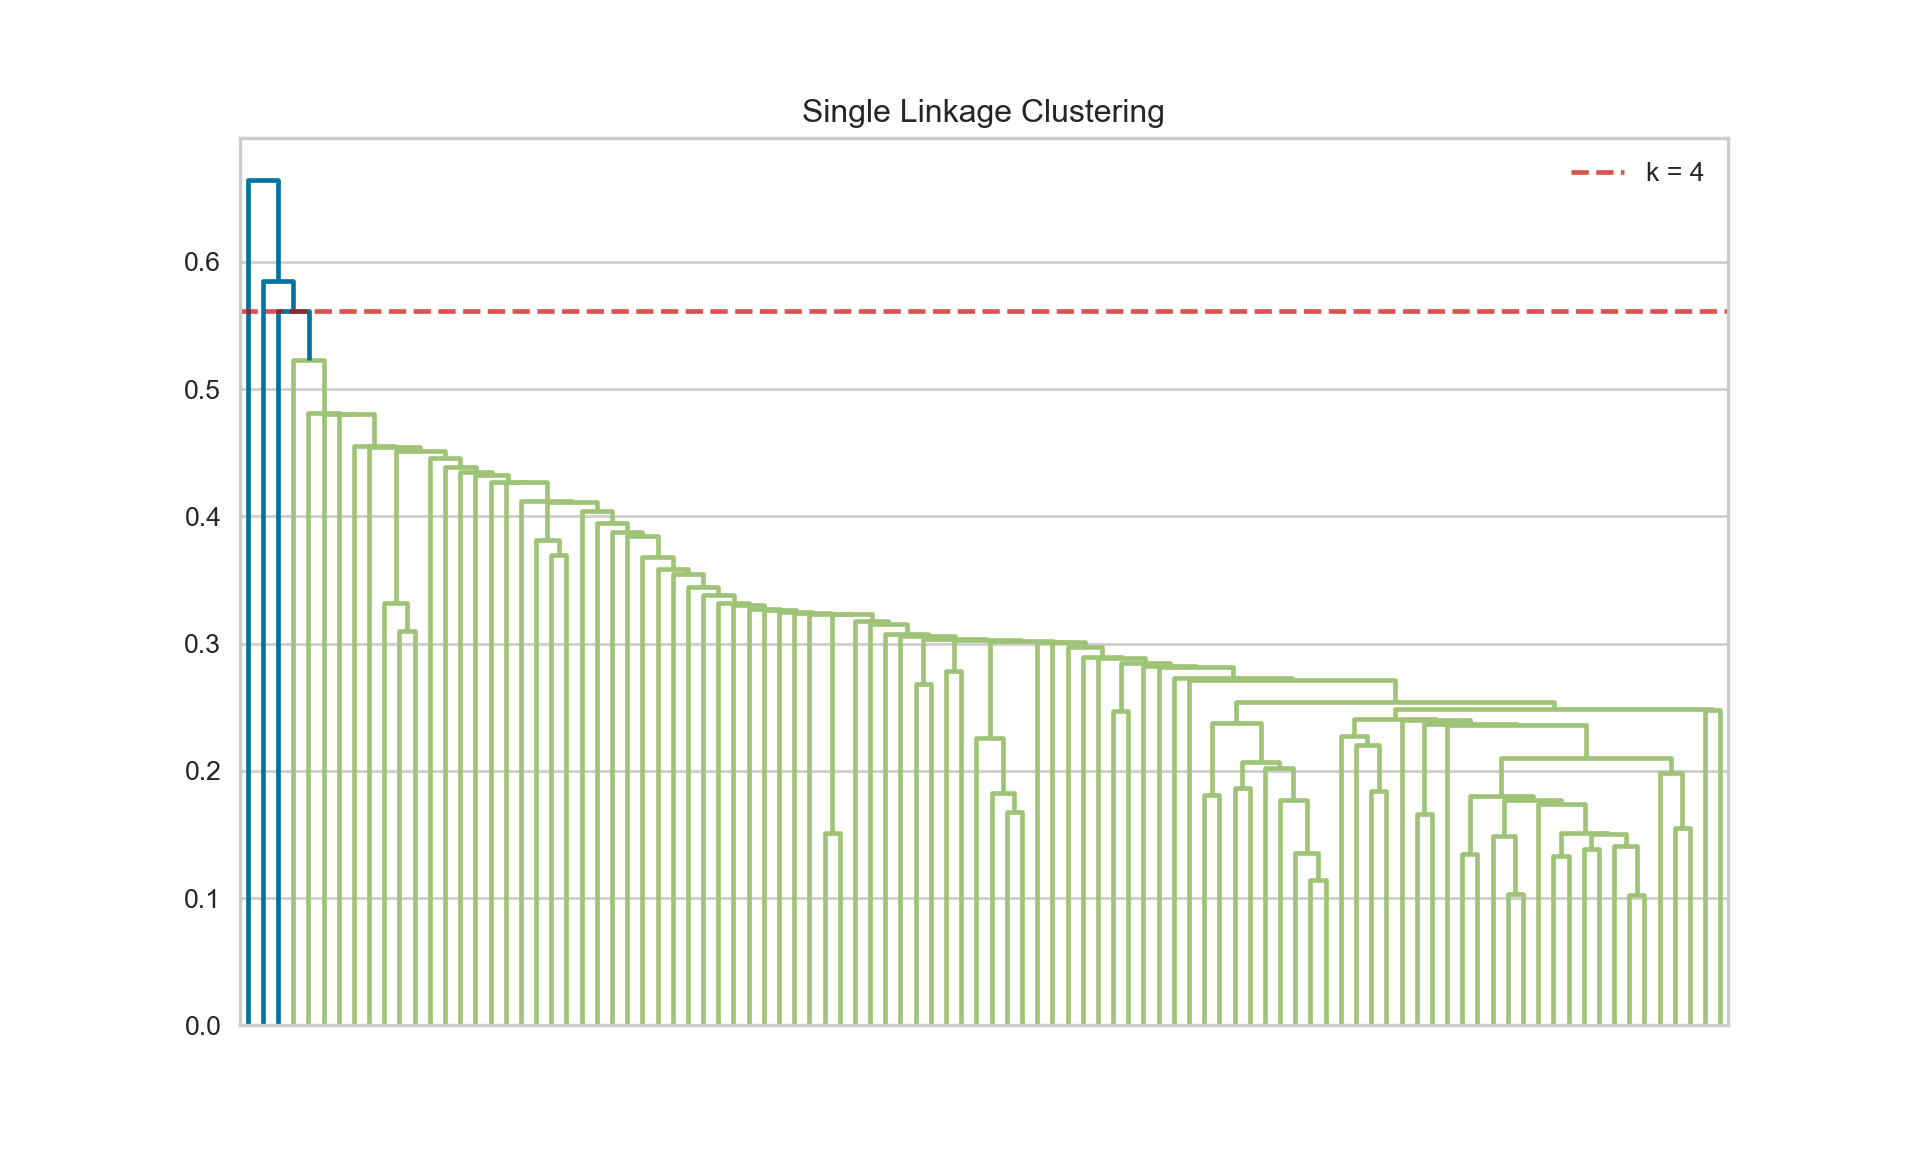
Changing the linkage method to single demonstrates the chaining effect on the dendrogram (Figure 25.10). Identifying a reasonable number of clusters is more difficult.

hc_s <- hclust(get_dist(glauc,method="pearson"),method="single")
plot(hc_s, cex=0.5,main="")
rect.hclust(hc_s,k=4)
Figure 25.10: Dendrogram for partial glaucoma data, single linkage.

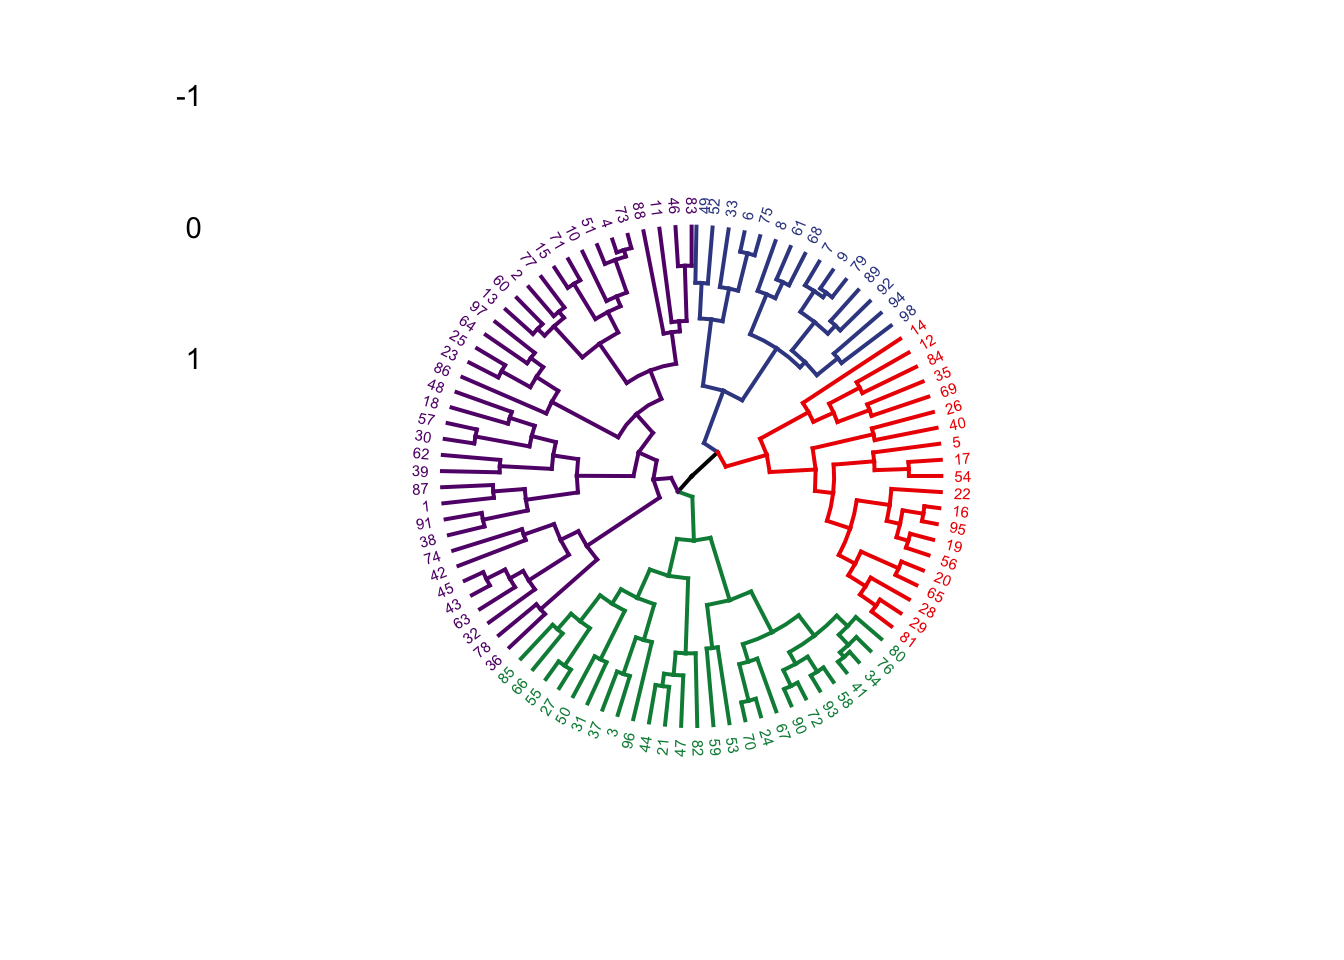
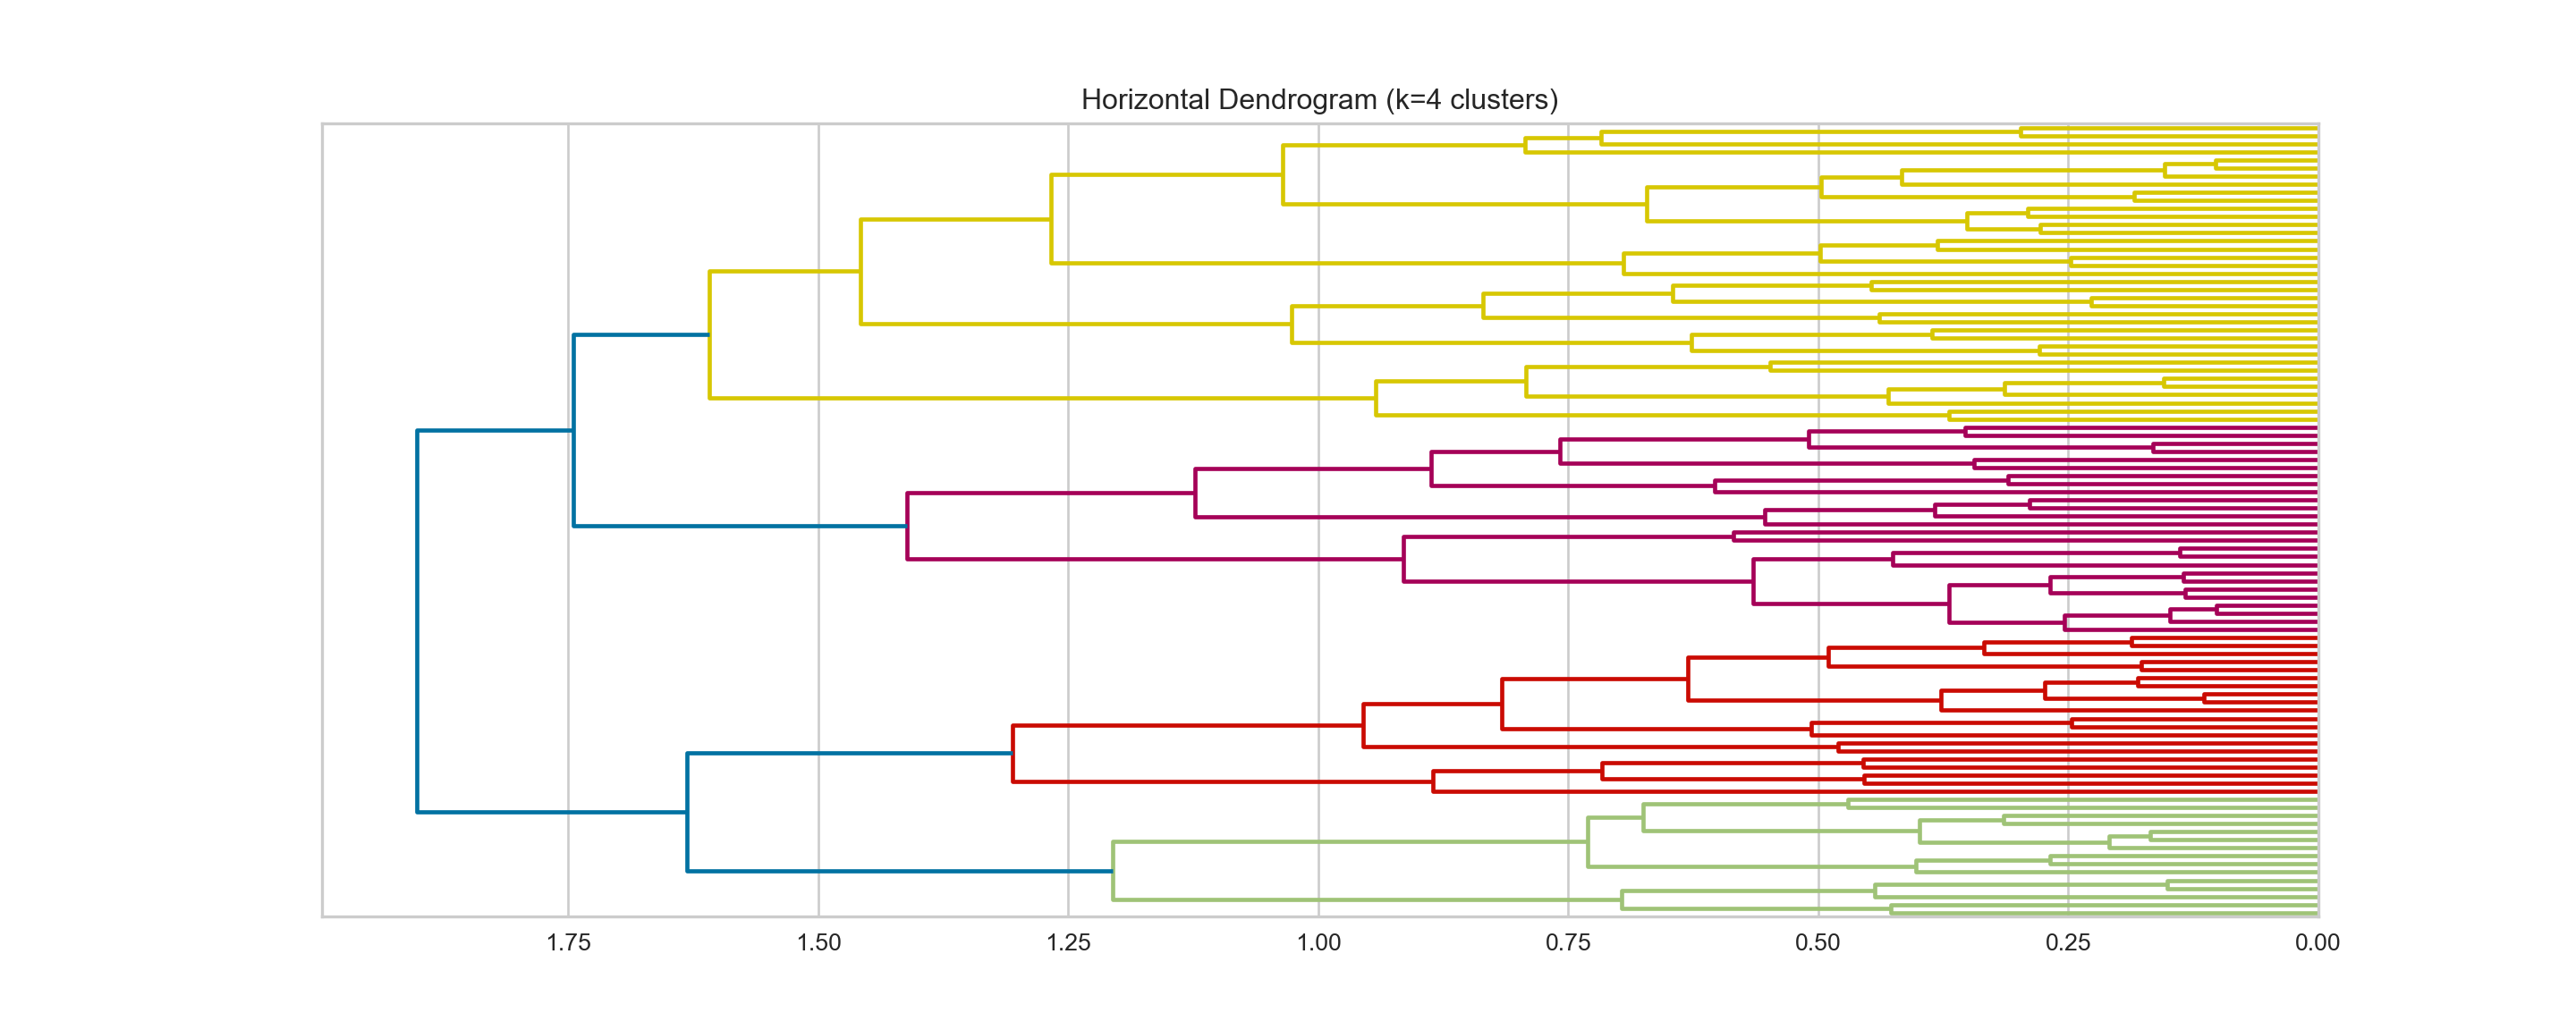
If you create a dendrogram object from the hclust results, a number of plotting functions are available to visualize the dendrogram in interesting ways. For example:

hc.dend <- as.dendrogram(hc) # create dendrogram object
plot(dendextend::color_branches(hc.dend,k=4),leaflab="none",horiz=TRUE)

factoextra::fviz_dend(hc.dend,k=4,horiz=TRUE,cex=0.4,palette="aaas",type="rectangle")

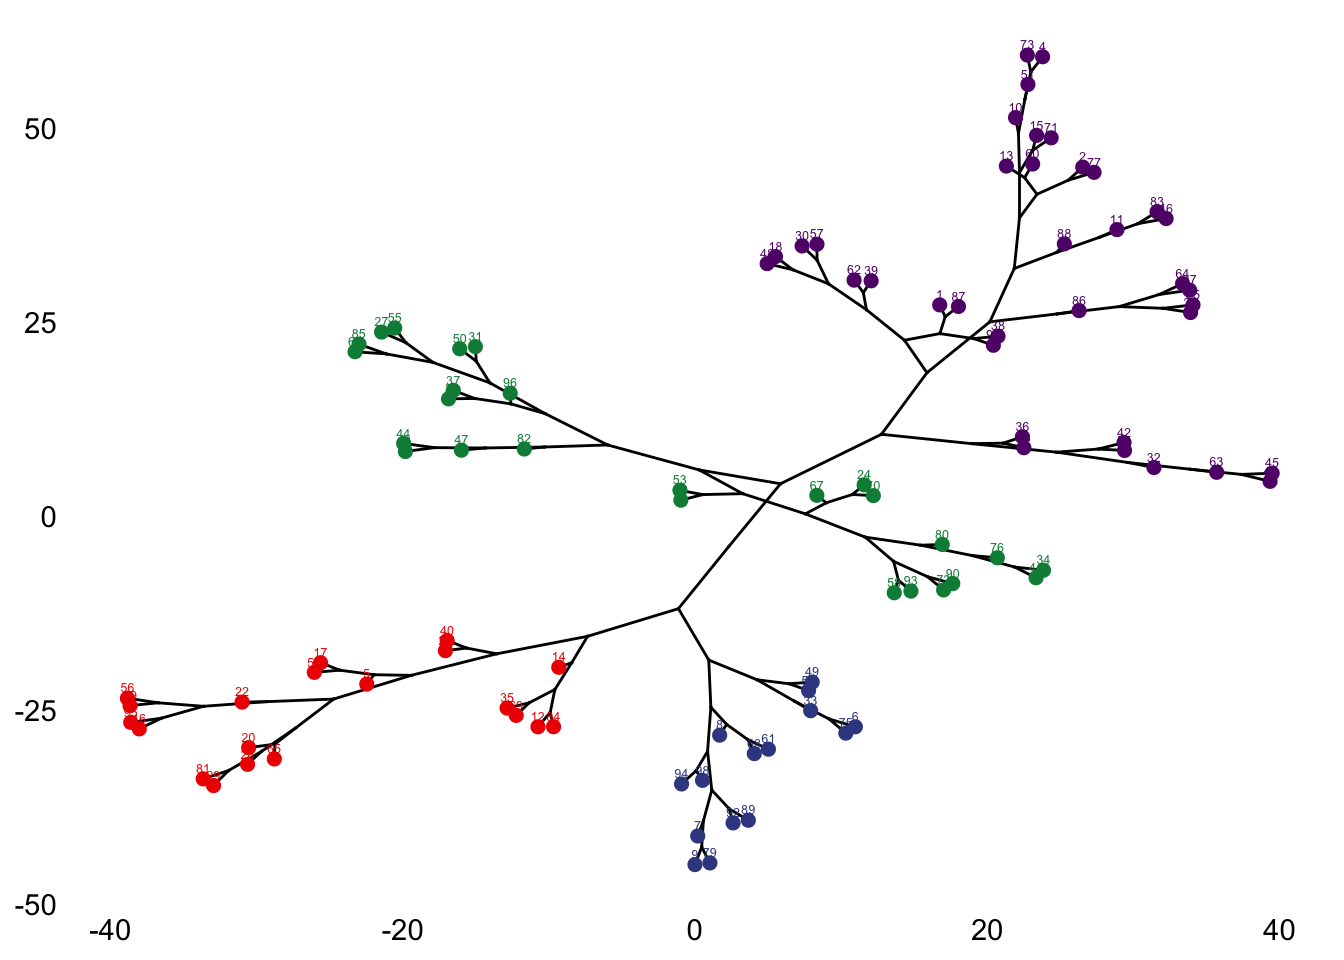
factoextra::fviz_dend(hc.dend,k=4,cex=0.4,palette="aaas",type="circular")

factoextra::fviz_dend(hc.dend,k=4,cex=0.4,palette="aaas",type="phylogenic")