Statistical Learning
Beyond the Numbers
Preface

Origin Story
Another treatise on statistical learning, data science, and machine learning. Sigh. Isn’t there enough material already?
The genesis of this material is a two-semester graduate-level data science methods sequence I am teaching at Virginia Tech. The courses are taken primarily by students from non-statistics programs.
They need to understand methods of supervised and unsupervised learning and apply them in the real world. They work on research problems much more complex than Palmer Penguins or Fisher’s Iris data. They are getting ready to take a role as a data scientist or statistical programmer at an organization. They want to know about classical and modern methods. They need to know how discriminant analysis is different from support vector machines but they do not know either of them yet.
At the same time, their background in foundational aspects of data science—statistics and probability, linear algebra, computer science—varies considerably. That is to be expected, many of us come to data science from a non-statistical, non-computer science path.
Philosophy
So I asked myself: suppose you have two semesters to convey data science methods at the M.S. level to this audience; what needs to be covered and at what depth? This material reflects the balance I strike between mathematical hand waving, theorems and derivations, algorithms, and details of software implementation.
Examples of this philosophy are hopefully evident throughout the parts and chapters:
Being able to implement all methods with software is just as important to me as their underpinnings in statistics, probability, and computer science.
Knowing how to build a multilayer neural network with Keras is as important as understanding how activation functions in hidden layers introduce nonlinearity.
Representing linear mixed models in terms of vectors and matrices of constants and random variables is relevant to match model components to software syntax.
Modeling overdispersed count data becomes a lot easier if mechanisms that lead to overdispersion are framed in terms of finite mixtures of random processes.
Generalized linear models are a natural extension of the classical linear model that can be understood without knowing the details of the exponential family of distributions. If you want to approach them from a theoretical perspective, knowing exponential family properties is not negotiable.
Nonlinear models and numerical optimization are under-served topics.
Mind Maps
I believe that an important aspect of learning material is to organize it and structure it. How to best compartmentalize a topic is personal. Unfortunately, someone else’s treatment enforces their structure on the material.
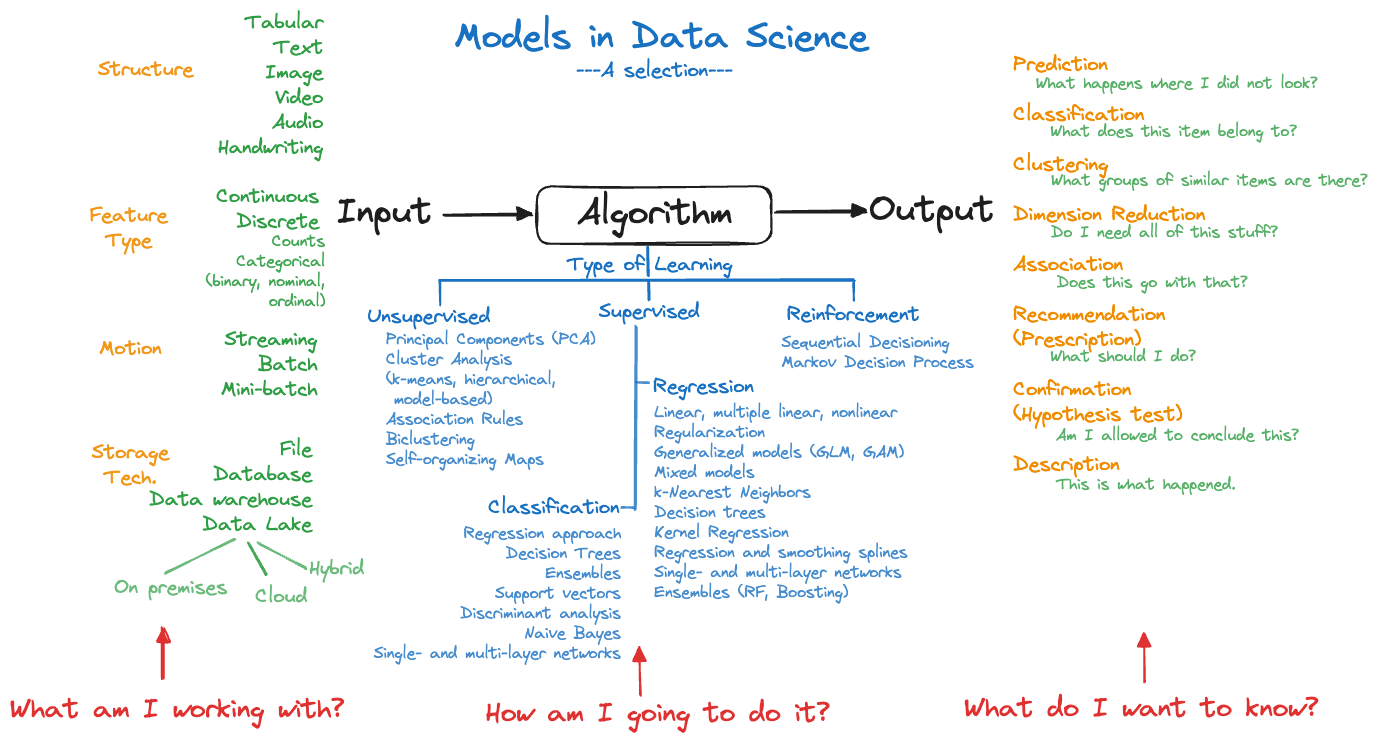
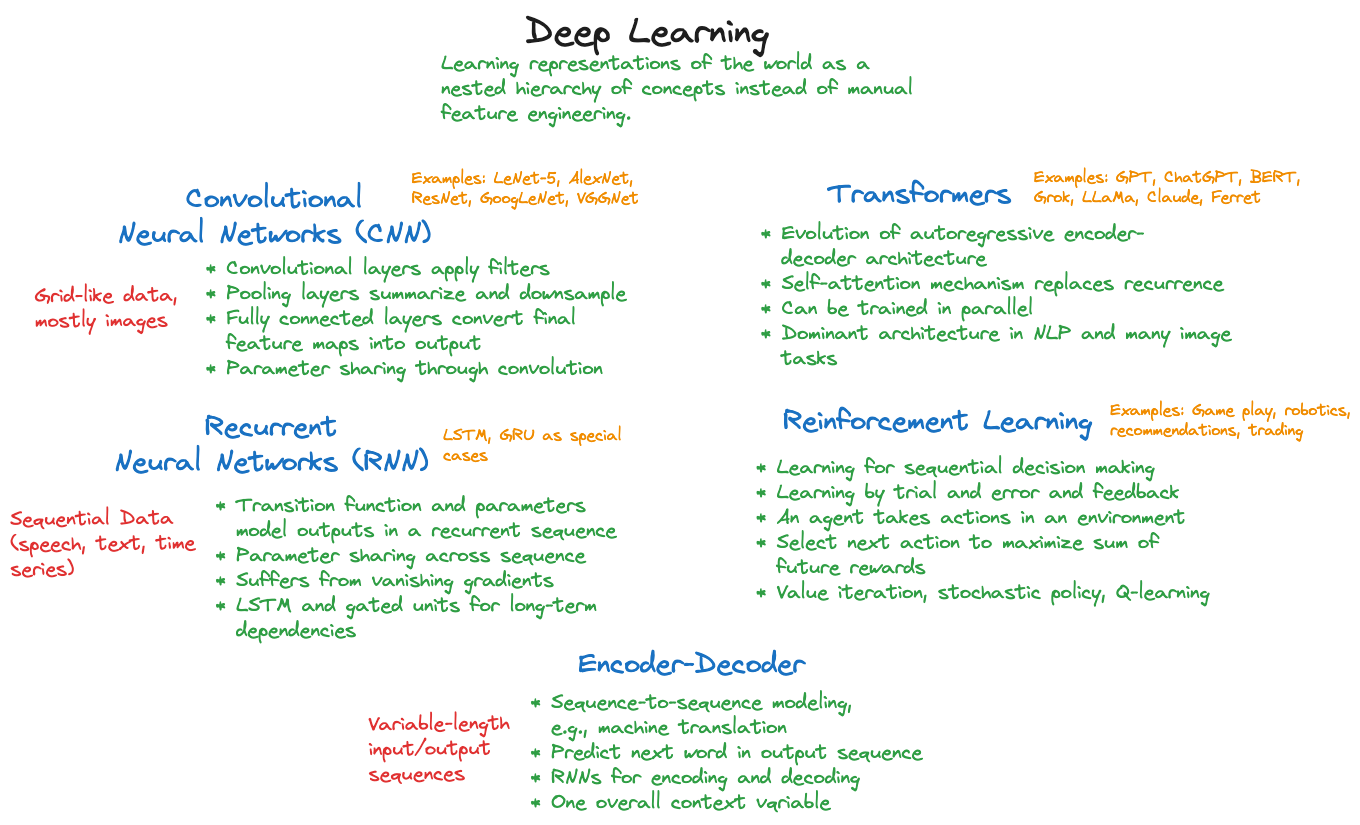
Many chapters contain mind maps that reflect my organization of a topic. For example, Figure 1 categorizes statistical modeling approaches in data science and Figure 2 is my high-level mind map for deep learning. Clicking on those and other images in the text zooma in them for a close-up view.
Statistical Learning
Statistical learning is a blend of statistical modeling and machine learning. It draws on a data-generating mechanism as in statistical modeling and it is inspired by a computing-oriented approach to solving problems with data. It leans more on predictive inference (prediction and classification) than confirmatory inference (hypothesis testing). It leans more on observational data where models need to be derived rather than the analysis of experiments where the experiment determines the model.
Statistical learning, unlike machine learning, is keenly interested in the uncertainty that transfers from the data-generating mechanism into the quantities computed from data and ultimately, into the decisions based on those.
Statistical learning, unlike statistical modeling, is open to algorithmic approaches to derive insights from data and recognizes data as a resource for learning. Working with data does not have to start with an hypothesis. It can start with the data.
If these remarks apply to you and this philosophy and approach appeals to you, then the material might work for you. If not, then there are oodles of other resources.
Software
The programming languages used throughout this material are R and Python. Wait, what? Yes, I spent the majority of my non-academic career at SAS—19 years—writing software for statistical analysis, developing distributed analytic platforms, leading R&D teams, and doing other stuff.
When I was in graduate school 30+ years ago, SAS was everywhere. You did not have to explain back then why teaching material was based on SAS. Today, the reality of statistics and data science is that almost all of it is done in R or Python. How things have changed.
R and Python
Regarding the R-vs-Python debate, it is my experience that those coming to data science from a statistical path prefer R, those coming from a different path are more familiar with Python as a general programming language.
R was developed as a statistical programming language–based on the S language. And it shows. It is highly efficient in interacting with data, in formulating statistical models, and R packages tend to make the results available that matter to statisticians. For example, not computing standard errors for estimated quantities is a head-scratcher for me. Those should matter in machine learning as well. The R code for statistical learning is short compared to the lengthy and wordy Python code I am writing for the same task. I must be doing something wrong.
In any case, we want to support the R coder and the Python coder. Many examples and applications in this material are bi-lingual. You can click on the R tab or the Python tab to see your preferred language. Other code and result snippets on the page flip to the chosen language. You should be able to view the entire material from an R perspective or a Python perspective. You might find it helpful to switch between the tabs every now and then to see how the same analysis is implemented in the other language.
We went to some lengths to make the bi-lingual examples match, but that is more difficult than you think. Random number generators do not produce the same sequence of random numbers; so we opted to generate simulated data once, store it in the database, and read the same data in both languages. Subtle differences in the meaning of model parameters can throw things off; a bandwidth of 0.5 in ksmooth (R) and KernelReg (Python) is not the same thing. Scaling in R divides by the standard deviation estimate with denominator \(n-1\), Python uses the denominator \(n\) instead. The list goes on and on. And, not surprisingly, there are statistical and machine learning capabilities in one language that are not available in the other language. Where it does not make sense to coerce the analysis in one language into the analysis into the other language or where we could not find an equivalent analysis, we let the differences stand.
This material is accompanied by Foundations of Data Science–Beyond the Numbers, a 3-credit, one-semester course that covers fundamental concepts in data science and the data science project life cycle.
All material is written in Quarto, because it handles multiple programming languages in the same document, works in RStudio like RMarkdown on steroids, incorporates \(\LaTeX\) beautifully, and creates great-looking and highly functional documents. To learn more about Quarto books visit https://quarto.org/docs/books.