41 Introduction
Training models is for show. Deploying models is for dough.
No machine learning model is valuable, unless it’s deployed to production.
Under the heading of operationalization in data science we combine multiple related concepts, the testing, deployment, and maintenance of data science solutions.
The real challenge in data science projects is not the model training. It is an important and often difficult part of the project, one on which we have spent much energy to develop tools, techniques, methodologies, and rigor. It is the deployment of the model into production—building systems that can handle real-world, real-time observations at scale, building systems that perform accurately and reliably on new, messy data—where the real challenge lies. And this is also where the business value happens.
Figure 41.1, taken from Sculley et al. (2015), is a schematic of a real-world machine learning system. The small box at the center of the graph, labeled “ML Code”, represents the trained model. The infrastructure that surrounds the model is large and complex. What the authors call serving is what we call scoring or inference: the model is exposed to new real-world data, it is serving the intended purpose.
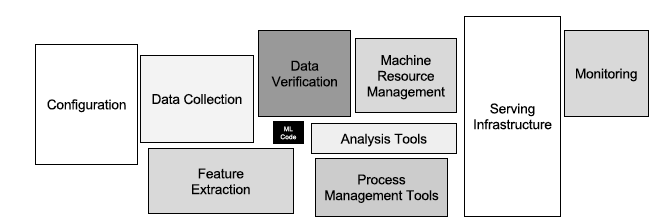
Deployment refers to the design and build of the serving infrastructure. It is only one part of operationalizing a data science solution.
Another important aspect of operationalizing a data science solution is to ensure that the solution meets the business needs. Should it not be a given at this point that the solution we built is beneficial to the organization? Otherwise, why would we have come this far?
Interestingly, there is generally a weak correlation between the performance of data science models during the model training phase and the performance of the models from a business perspective. Accuracy and mean squared prediction error do not necessarily correlate highly with business metrics such as click-through rates, lead conversions, net retention, or annual recurring revenue (ARR). Put differently, models that perform well on statistical grounds are not necessarily moving the needle for the business. This is not a lack of correlation between offline and online performance metrics, but between gains in model performance metrics and gains in business value. A model with improved accuracy or lower test error might not result in (much of a) gain for the business. How is this possible?
- Statistical performance can be a poor surrogate for a business KPI (key performance indicator).
- Performance is often measured in aggregate (for all groups) but can vary between groups. A model that performs better overall might not be an improvement for an important subset.
- You cannot derive business value from model improvements indefinitely. Eventually, you reach a saturation point. Increasing model accuracy from 96% to 96.5% might not make a difference in practice.
- The uncanny valley effect, a concept from robotics, describes the human emotional response to anthropomorphism of robots. With increasing human-like behavior of the robot we have an increasingly positive emotional response. However, there comes a point where small imperfections create a very negative response. In data science, an uncanny valley effect might materialize when a model’s predictions are too good and freak out or creep out the user. Instead of affecting customer behavior positively, an improved model that steps into the uncanny valley can decrease customer satisfaction.

Model testing and A/B experimentation are ways in which models are evaluated from a business standpoint and how we can establish whether a change in the model causes a change in the business. While some of the business impact can be anticipated, nothing compares to proving that a change causes a positive effect by running a randomized controlled experiment where some users are exposed to the current state and others are experiencing the new (or improved) model. Google is said to run about 10,000 A/B experiments every year—that amounts to about 30 experiments every day. Chances are that you have been unwittingly participating in online A/B tests when using Google products.
You see that there is more to operationalization than throwing a Jupyter notebook over the fence to the IT department. Notebooks are great for literate programming, exploration, and development. Notebooks and markdown are where you start, not where you stop. Models need to turn into modular code that is orchestrated, exposed via APIs and deployed as endpoints. A production mindset is key.
Because data are involved, a data science solution is not like other software projects. That is why over the past years a set of principles, practices, and tools has emerged in support of operationalizing data science. The machine learning community calls this MLOps.
41.1 MLOps
The complete set of practices to operationalize machine learning (data science) solutions is called Machine Learning Operations (MLOps for short). DevOps (Development Operations) is a set of practices and principles in software development that allows organizations to deliver quality software more efficiently and reliably. It emphasizes the collaboration of developers and IT operations, and is built around principles such as
- Continuous Integration and Delivery (CI/CD). The process of continuously integrating code into repositories, automating builds, and continuously testing and delivering software to its users.
- Version Control. Tracking changes to files to facilitate collaboration, rollback, and auditing.
- Automation. Automating infrastructure and workflows.
- Customer Focus. A customer-centric approach that ensures software is delivered reliably and quickly and meets the customer needs.
MLOps builds on DevOps principles, but it is not simply DevOps applied to machine learning (data science) models. MLOps is its own discipline due to these fundamental differences:
Data centricity. While DevOps focuses on code and infrastructure, MLOps adds the data management dimension. MLOps does not just deploy code, it must manage data. For example, deploying an online scoring system requires the integration of real-time data and historical batch data for a near real-time response.
Experimentation. Traditional software does not require much experimentation, its outcomes are deterministic. Developing a data science solution involves multiple model choices, trial and error, and hyperparameter tuning. The MLOps workflow must allow for experimentation and trials. It also must allow for experimental validation whether a new model improves business outcomes.
Testing. Testing data science solutions is more complex than testing traditional software. In addition to the pass/fail-style testing of code functionality, testing involves the evaluation of statistical quantities (accuracy, test error, precision, recall) and their distributional properties. There are no simple pass/fail criteria for these.
Monitoring. DevOps monitoring focuses on the health of the system such as latency, error rates and messages, and resource consumption. MLOps must also monitor model-specific concerns such as accuracy across all data and for groups (once target values become available), data and concept drift, bias, …
Retraining. Changes in machine learning models can be made independently of software releases. Retraining a model can be triggered by events such as data drift or a drop in accuracy. MLOps needs mechanisms for detecting and automating retraining without requiring a re-deployment of applications that use the models.
Deep Collaboration. DevOps focuses on the collaboration between software developers and IT operations. Data science solutions involve even more roles such as data engineers, data scientists, machine learning engineers, etc.
So while MLOps absolutely incorporates DevOps principles such as automation, version control, and CI/CD, it extends them to address the unique challenges of operationalizing machine learning systems at scale. Rather than simply applying DevOps tools and practices, organizations often find that moving data science solutions into practice needs an entirely different set of tools and processes.
Core Components of MLOps include:
- Version Control. Not just for code, but also for data sets, model parameters, and hyperparameters. Tools like DVC (Data Version Control) alongside Git help track everything that influences model behavior.
- CI/CD for Data Science. Automated testing and deployment pipelines adapted for data science workflows, including data validation, model validation, and A/B testing.
- Model Registry. Central repository to catalog and manage models, their versions, and metadata throughout their lifecycle.
- Feature Store. Infrastructure to consistently create, store, and serve features for training and inference.
- Monitoring & Observability. Systems to track model performance, data drift, concept drift, and resource utilization in production.
- Automated Retraining. Pipelines to automatically retrain models when performance degrades or new data becomes available.
- Infrastructure as Code. Defining compute resources, scaling policies, and environments as code for reproducibility.
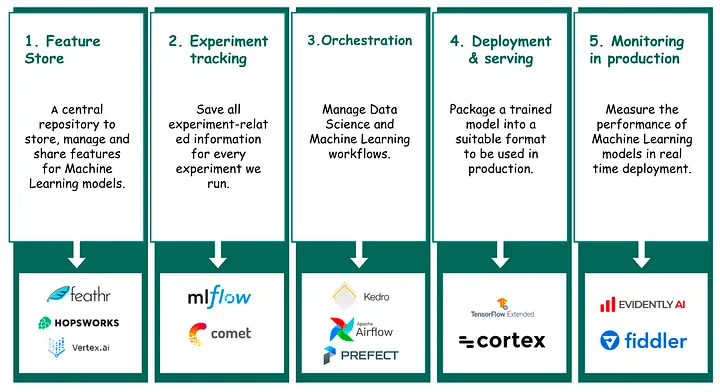
Figure 41.3 displays pillars of MLOps and tools that might be used, according to Rouis (2023).
41.2 Application—Lead Scoring
In this module we will take a simple data science model for lead scoring and take it through the paces of operationalization. The goal is to have a working implementation for offline (batch) lead scoring to support the Sales and Marketing departments of a fictional company. But first, what is lead scoring?
What is Lead Scoring?
A lead is a potential customer of a company that sells products or services. Lead scoring is the methodology that ranks the leads by assigning a numeric value that represents the value of the customer to the company. The value can reflect their propensity to buy products and services, the quality of information about the lead, or how closely the lead matches an ideal customer profile. The Sales team is interested to pursue high-quality leads, who have shown enough interest and given signals that they are likely to buy. These are also called marketing-qualified leads and are turned over to the Sales department. Leads that have a lower likelihood to buy goods and services are handed to the Marketing department for lead nurturing. That is a nice way of explaining why companies continue to bug you—you are being nurtured.
Lead scoring is a data science problem because the qualification of leads—the scoring part—is based on data. A lead scoring model combines demographic data such as a person’s location, job title, the size and industry of their company, with behavioral data. Whether you opened an email, which pages you visit on the website, whether you call the support team, engage on social media, request a demo or start a free trial, these are behaviors that reflect your likelihood to become (or remain) a paying customer.
Methodologies
Lead scoring models can use different methodologies.
An ICP fit model compares geographic and demographic data about the lead to an ideal customer profile (ICP). The closer a lead is to the ICP, the higher the score. This is a first step in lead scoring, two leads with the same score can have very different propensity to buy.
Activity-based models take into account actions the lead take in the marketplace. Attending a user conference or trade show, researching similar products or landing on your website, are signals about someone’s interest.
Subtractive models start from a baseline and reduce the score based on attributes and activities that are not a good fit for you. Working for a competitor, unsubscribing from email lists, researching the careers page rather than the product page of your website will reduce the score. This method does not find the best leads to engage with, its goal is to remove leads to not waste your time on.
A predictive model of intent to buy uses data to estimate the probability of conversion. In sales-and-marketing speak, conversion is not the act of adopting a religion, but to become a paying customer. A point scoring model awards positive points for behaviors or information that increase the likelihood to buy and negative points for behaviors that detract from it. Opening an email, for example, might gain you 5 points, registering for a webinar with a .gmail account 10 points, registering for the same webinar with an organizational account (.com, .edu, .gov, …) gains you 20 points, 30 if you represent the target industry. Unsubscribing from the email list might deduct 10 points form your lead score, your organization not being profitable in the last quarter might deduct 20 points.
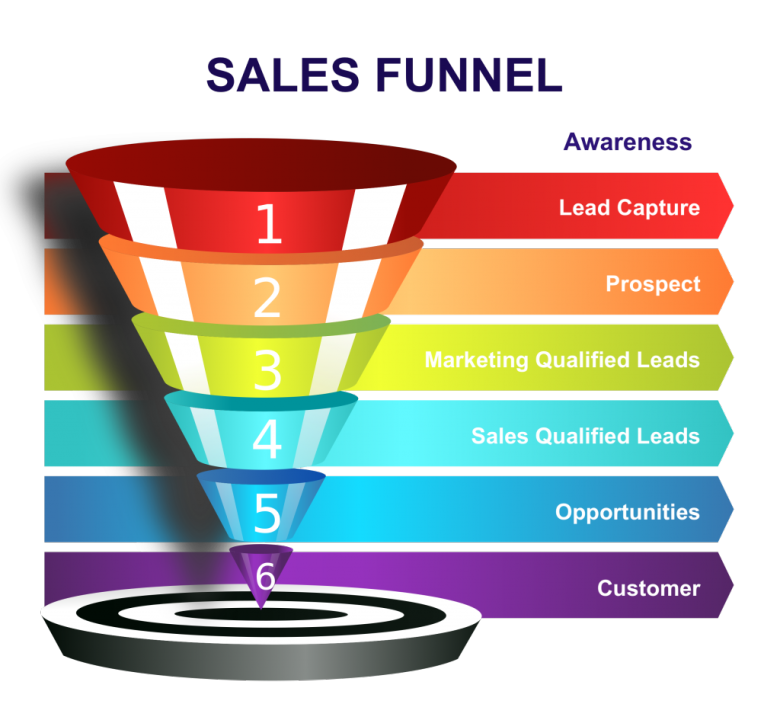
Regardless of the lead scoring methodology, leads are typically ranked. If their score exceeds a threshold, they are handed to the Sales department as marketing-qualified leads. In addition to the lead score, an SDR (Sales Development Representative) can be tasked with further qualifying the leads, determining if they meet the criteria for further sales engagement (a sales-qualified lead). Congratulations, you are on the verge of getting phone calls, text messages, or emails from the Sales department.
The journey potential customers go through on the way to becoming paying customers is captured in the sales funnel (Figure 41.4). The funnel decreases in size from top to bottom as prospects and leads drop out.
Every company has a lead scoring methodology. While the concept and practice are well understood, the internals are considered proprietary, every company is convinced that they have the best lead scoring methodology. Changing lead scoring algorithms can be disruptive to Sales and Marketing departments. Improving lead scoring increases sales volume (revenue) Modifying a lead scoring algorithm is a chance for the data science team to go from zero-to-hero or from hero-to-zero.
41.3 Deployment Considerations
Choosing how to deploy a data science solution takes into account many factors. It is easy to over-engineer a deployment, wasting time and money. It is easy to under-engineer a deployment, missing performance service levels and lacking robustness and scale. Important considerations are
- how frequently model inference is performed
- how model inference is triggered: on demand, on a schedule, by events
- whether inference is performed on individual records, small groups of records (mini batches), or larger databases (batch inference)
- the scalability requirements
- the resiliency requirements
- the latency requirements
- which applications need to access the model results
An important decision that determines many requirements and defines the complexity of the deployment is whether to service the model in offline mode or in online mode.