graph TD
    B["Business Understanding"]:::phase --> D["Data Understanding"]:::phase
    D --> B
    D --> P["Data Engineering<br/>Module III"]:::phase
    P --> D
    P --> M["Modeling Data<br/>Module IV"]:::phase
    M --> P
    M --> E["Evaluation & Communication<br/>Module V"]:::phase
    E --> M
    E --> DEP["Operationalization<br/>Module VI"]:::phase
    DEP --> MON["Monitoring"]:::phase

    B -.- B1["• <u>Frame problem/solution</u><br/>• Define KPIs<br/>• Set success criteria"]
    D -.- D1["• Identify & explore data<br/>• Verify quality<br/>• Identify subsets"]
    P -.- P1["• Clean & transform<br/>• <u>Feature creation</u><br/>• <u>Feature selection I</u>"]
    M -.- M1["• Build models<br/>• <u>Feature selection II</u><br/>• Evaluate models"]
    E -.- E1["• Evaluate vs KPIs<br/>• Communicate to stakeholders"]
    DEP -.- DEP1["• Pilot & full deployment<br/>• KPI evaluation"]
    MON -.- MON1["• Monitor performance"]

    classDef phase fill:#f9f9f9,stroke:#333,stroke-width:2px
%%    classDef note fill:#fff,stroke:#999,stroke-width:1px

    class B,D,P,M,E,DEP,MON phase
    class B1,D1,P1,M1,E1,DEP1,MON1 note
8 Introduction
Generative AI
This material was created in part with help of Claude 3.7 Sonnet from Anthropic.
The CRISP-DM methodology remains one of the most widely adopted frameworks for data mining projects (Shearer 2000). While various other methodologies have emerged (Mariscal, Marban, and Fernandez 2010; Kurgan and Musilek 2006), CRISP-DM’s emphasis on business understanding has contributed to its longevity (Martinez-Plumed et al. 2021). Figure 8.1 shows an augmented flow of a data science project according to this methodology. You see the steps reflected in the module organization of our material.
A majority of data science projects start with the Business Understanding phase, in which business stakeholders and the data science team collaboratively work to frame the business opportunity and explore possible data science solutions.
Main Objectives
This phase establishes the foundation for the entire data science project by translating business objectives into data science goals and developing a comprehensive project plan.
The main objectives of the Business Understanding phase are to:
- Establish clear business objectives that align with organizational strategy
- Translate business goals into specific, measurable data mining objectives
- Assess project feasibility from business, technical, and resource perspectives
- Develop a comprehensive project plan including timeline, resources, and success criteria
- Identify key stakeholders and establish communication protocols
While most of the work in this phase occurs early in the project, this phase will likely need to be revisited (often many times) as both stakeholders and data science teams better understand the problem and solution space. Most high-value data science projects are very complex with interconnected objectives and systems that require deep knowledge of processes, data, and (often competing) business objectives. As a rough estimate, expect to spend 15–25% of the total project time in this phase.
8.1 Two-way Street
The primary role of the Business Understanding phase is to provide a two-way discovery process between stakeholders and the data science team. It is a two-way process because stakeholders need to understand the art of the possible from a data science perspective, and the data science team needs to fully understand the business opportunity, including alignment with strategic company objectives, business benefits, measurement criteria, and potential roadblocks. The success of many data science projects is often determined by the effectiveness of the work done in this phase of the process. Misalignment due to ineffective Business Understanding can result in project failure due to unrealistic expectations on outcomes, failure to identify “showstopper” risks, or lack of support due to poor strategic alignment.
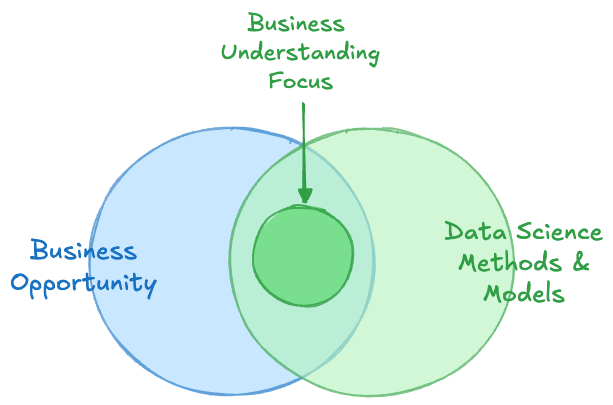
When data scientists have a shallow understanding of business processes and opportunities, they often create trivial solutions that offer little value to the business. They may focus on building solutions where data is easily accessible or on leveraging cutting-edge algorithms. This can result in business users questioning the value of the entire data science approach.
When business users don’t understand the capabilities of data science, they tend to fall back on old patterns of thinking (often business intelligence-based) that do not leverage the power of fully integrated predictive and prescriptive solutions (Debortoli, Müller, and Brocke 2014). Business intelligence applications masquerading as data science projects deliver less value, resulting in the business questioning the value of the entire data science investment (Provost and Fawcett 2013).
8.2 Critical Success Factors
Stakeholder Engagement
- Executive Sponsorship: Ensure strong leadership support and commitment
- Domain Expertise: Involve subject matter experts throughout the process
- Cross-functional Collaboration: Engage IT, operations, and end-users early
Clear Communication
- Shared Vocabulary: Establish common understanding of technical and business terms
- Regular Updates: Maintain transparent communication about progress and challenges
- Expectation Management: Set realistic timelines and deliverable expectations
Thorough Documentation
- Detailed Requirements: Capture both explicit and implicit business needs
- Assumption Documentation: Record all assumptions for future validation
- Change Management: Establish processes for requirement modifications
8.3 Pitfalls and Mitigation Strategies
Vague or Conflicting Objectives
Example: Telecommunications
A telecommunications company initiated a “customer analytics project” with the stated goal to improve customer satisfaction and reduce costs. Different stakeholders interpreted this differently:
- Marketing wanted to increase customer lifetime value through targeted campaigns
- Customer service wanted to reduce call center volume through predictive issue resolution
- Finance wanted to minimize operational costs by identifying unprofitable customers for termination
- Operations wanted to predict network capacity needs to prevent service degradation
The project stalled for three months as teams worked on different solutions, leading to wasted resources and stakeholder frustration.
Symptoms of this pitfall are unclear success criteria and multiple interpretations of project goals among stakeholders and teams. Mitigation strategies include
- Structured stakeholder workshops with specific outcome documentation
- Use SMART criteria (Specific, Measurable, Achievable, Relevant, Time-bound)
- A single, prioritized list of objectives with clear trade-offs documented
- Objective validation through stakeholder sign-off processes
Inadequate Resource Assessment
Example: Retail Banking
A retail bank launched a credit risk modeling project assuming their customer transaction data was complete and accurate. The business understanding phase focused heavily on regulatory requirements and business rules but did not thoroughly assess data quality. Six weeks into the project, the team discovered:
- Transaction data was missing for 30% of customers due to system migration issues
- Income data was self-reported and highly unreliable (many customers reported $1 annual income)
- Credit bureau data integration had been failing silently for eight months
- No one on the team had experience with regulatory model validation requirements
The project was delayed by four months and required hiring external consultants, doubling the budget.
Symptoms of this problem are data quality issues that are discovered (too) late or not identifying sufficient expertise across the organization. Mitigation strategies include
- Comprehensive data audits including completeness, accuracy, and timeliness assessments
- Detailed skills gap analysis against project requirements
- 25-30% buffer time for data preparation and for ramping up the team
- Data quality checkpoints throughout the project lifecycle
Poor Stakeholder Alignment
Example: Healthcare
A healthcare organization began a patient readmission prediction project with initial support from the Chief Medical Officer (CMO). However, key stakeholders were never properly aligned:
- The CMO wanted clinical insights to improve patient care protocols
- Hospital administration wanted to minimize Medicare penalties (focus on 30-day readmissions)
- IT department wanted to integrate predictions into existing EMR workflow
- Quality assurance wanted detailed audit trails for compliance
- Nursing staff (end users) were never consulted about workflow integration
Midway through the project, the CMO left the organization. Without clear governance, each group began requesting different features. The project scope expanded by 200%, timelines slipped repeatedly, and the final model was never deployed because nursing staff refused to use a system they found disruptive to patient care.
Symptoms of this issue are changing requirements, conflicting priorities, and insufficient support. Mitigation strategies include
- Formal project governance with clear decision-making authority
- Map all stakeholders including end users, not just sponsors
- Document and communicate competing priorities early with explicit trade-off decisions
- Regular stakeholder review cycles with structured feedback processes
- Secure multiple levels of organizational commitment, not just individual champions
Unrealistic Expectations
Example: E-commerce
An e-commerce company wanted to build a recommendation engine to compete with Amazon’s system. Business stakeholders, having read about AI successes in the media, set the following expectations:
- Increase conversion rates by 40% (industry average improvement is 10-15%)
- Deploy within 8 weeks (typical timeline for robust recommendation systems is 6-12 months)
- Achieve 95% accuracy in predicting customer preferences (Amazon’s system evolved over decades)
- Work perfectly from day one with no user behavior data collection period
- Cost less than $50,000 total (including infrastructure, which alone would cost more)
The project was deemed a “failure” when it achieved a 12% conversion improvement in 16 weeks, despite this being a significant business success by industry standards.
Symptoms of this issue are overly ambitious timelines and unrealistic performance targets. Mitigation strategies include
- Present industry benchmarks early in planning discussions
- Run a pilot project to demonstrate realistic timelines and performance
- Phased implementation with incremental value delivery
- Educate stakeholders on typical machine learning project timelines and performance curves
- Define minimum viable product (MVP) and stretch goals with clear expectations
- Document assumptions about baseline performance and improvement potential