27 Model Types
27.1 Introduction
There are many ways to organize data science (machine learning, statistical) models. The most common categorization starts by distinguishing models based on the learning approach: supervised, unsupervised, reinforcement, self-supervised, and active learning. Supervised learning is then organized into methods for regression methods for classification, and so on (see Figure 23.3).
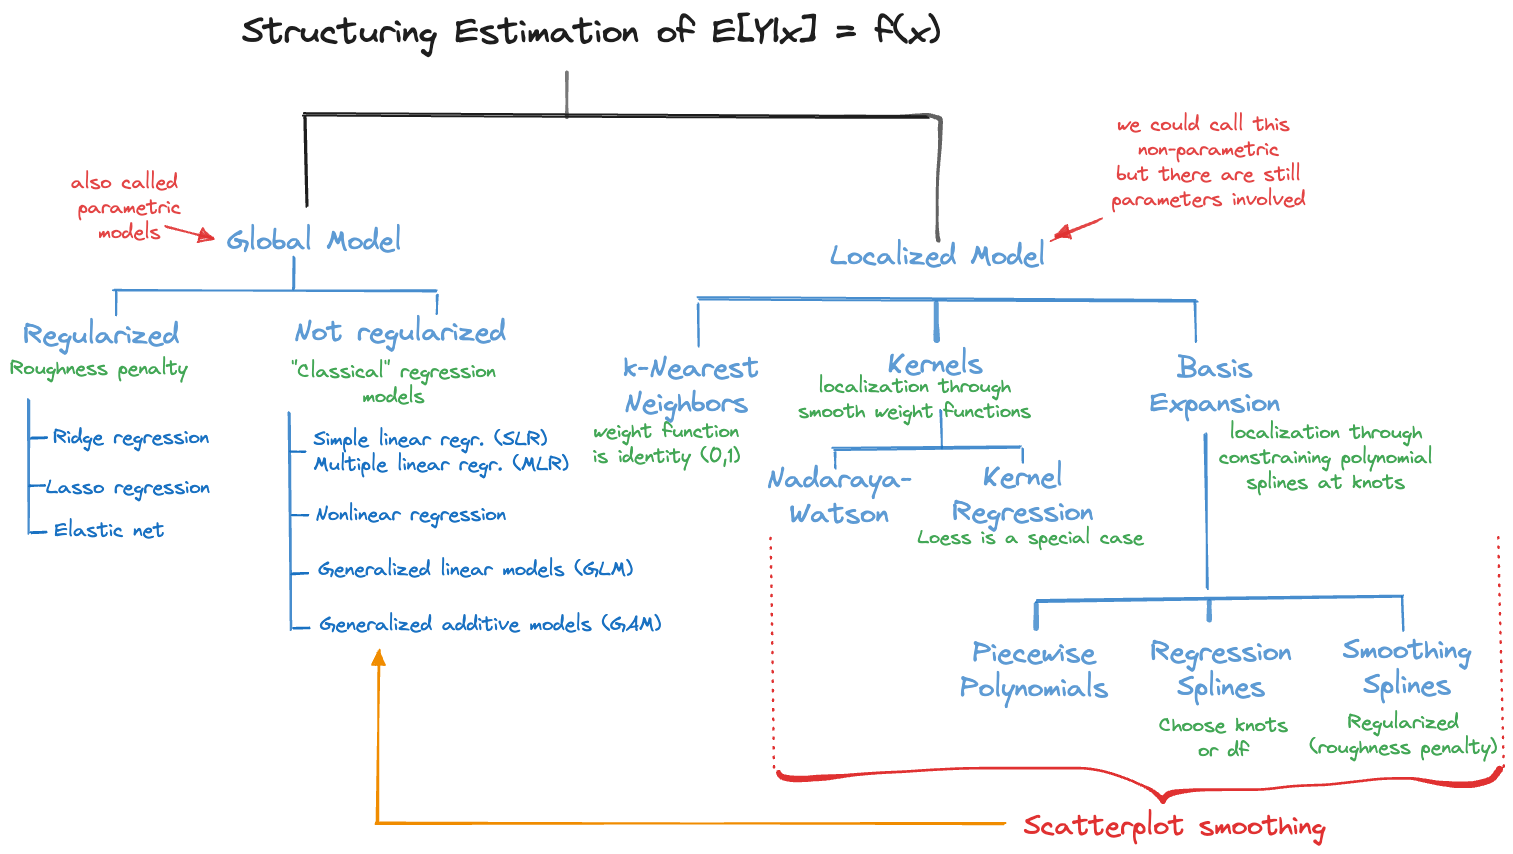
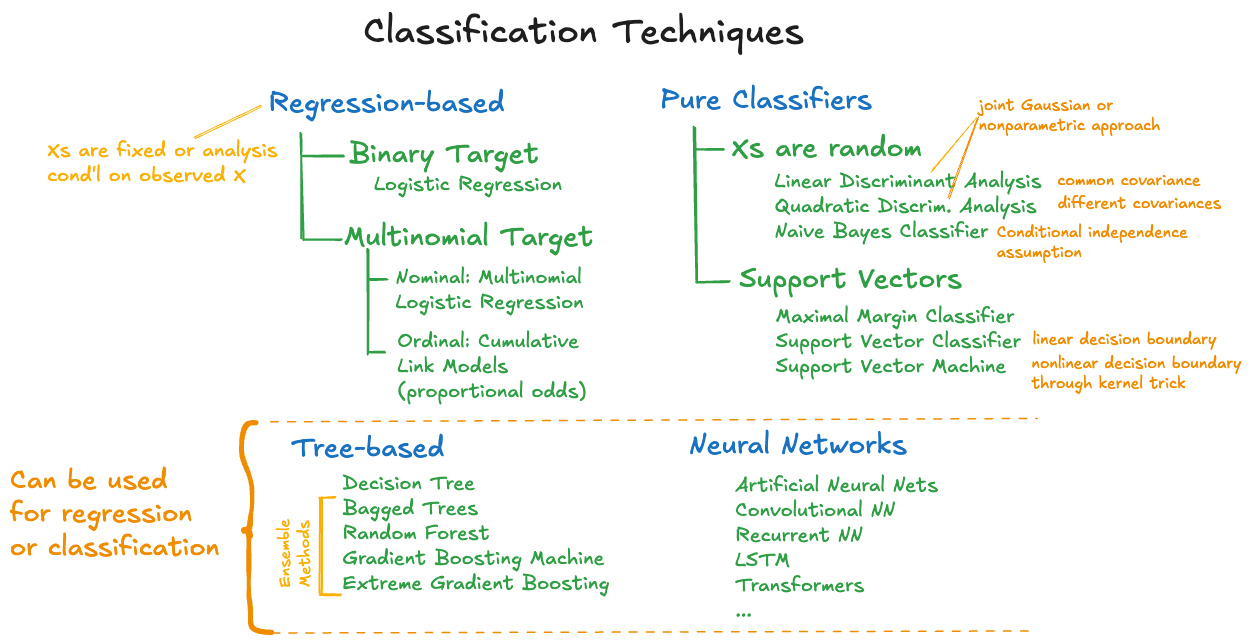
Along these lines, Figure 27.1 breaks regression-type methods down further based on whether they take a global or local approach and whether they regularize the objective function. Figure 27.2 is an attempt at organizing approaches to classification.
While common, these categorizations obscure the practical utility of different approaches. A neural network can be used for classification and regression. Recommender systems can be built using supervised or unsupervised methods. Long Short-Term Memory (LSTM) models can answer questions across different domains, e.g., analyzing text and forecasting time series.
We present in this chapter a novel classification framework for machine learning models based on the types of questions they can answer, rather than traditional algorithmic taxonomies. This should help you learn to think problem-first rather than algorithm-first. This question-driven approach aligns model selection with business objectives and research goals, and connects technical methods to real-world applications immediately.
In the following sections statistical learning models are organized around five fundamental question types that practitioners encounter in real-world situations:
- “What will happen?”—Prediction Questions
- “What patterns exist?”—Discovery Questions
- “What should I do?”—Decision Questions
- “Why did this happen?”—Understanding Questions
- “What new content can be created?”—Generation Questions
Models appear across multiple question types. For example, a random forest can be used in a regression context to predict a continuous value and in a classification context to associate observations with categories.
This material was created with help of Claude 3.7 Sonnet from Anthropic.
27.2 “What will happen?”—Prediction Questions
Prediction models enable proactive decision-making by forecasting future states, helping organizations plan resources, mitigate risks, and capitalize on opportunities.
Example: Netflix Content Demand Forecasting
Netflix uses prediction models to forecast which shows will be popular in different regions and time periods. This enables them to:
- Negotiate better licensing deals for content they predict will be in high demand
- Decide which original content to produce for specific markets
- Optimize their content delivery network by pre-positioning popular content
- Plan marketing budgets around predicted viewership patterns
“What specific numerical value should we expect?”—Continuous Value Prediction
- Key Characteristic: Target is a continuous numerical attribute
- Models: Linear regression, polynomial regression, neural networks, random forest regression, support vector regression
- Applications: Stock price forecasting, demand forecasting, property valuation, weather prediction
- Business Value: Enables precise resource planning and financial projections
Example: Amazon Inventory Management
Amazon predicts exact quantities of products to stock in each fulfillment center. Their models forecast that they will need 847 units of a specific phone case in their Phoenix warehouse next week, 1,203 units in Atlanta, and 692 units in Seattle. This precise numerical forecasting enables them to minimize storage costs while avoiding stockouts, directly impacting their bottom line through optimized inventory carrying costs.
“Which category will this belong to?”—Categorical Outcome Prediction (Classification)
- Key Characteristic: Target is a categorical variable, comprising two or more discrete categories
- Models: Logistic regression, decision trees, random forests, neural networks, gradient boosting machines, Xgboost, naïve Bayes, SVM classification, discriminant analysis, …
- Applications: Email spam detection, medical diagnosis, customer churn prediction, image classification
- Business Value: Supports automated decision-making and risk assessment
Example: PayPal Transaction Classification
PayPal categorizes every transaction as either “legitimate,” “suspicious,” or “fraudulent.” When a $500 transaction comes from a new device in a different country, the model might classify it as “suspicious,” triggering additional verification steps. This classification enables automated fraud prevention while minimizing false positives that would annoy legitimate customers.
“How likely is this outcome?”—Probability Estimation
- Key Characteristic: Target includes confidence intervals or probability distributions
- Models: Bayesian networks, logistic regression, probabilistic neural networks, calibrated classifiers, ensemble methods with uncertainty quantification
- Applications: Risk assessment, medical prognosis, fraud detection, A/B testing
- Business Value: Enables risk-adjusted decision making and resource allocation
Example: Insurance Premium Pricing
Progressive Insurance estimates that a 25-year-old driver in Chicago has a 3.2% probability of filing a claim in the next year, with a 95% confidence interval of 2.8%-3.7%. This probability estimate, combined with the expected claim cost distribution, allows them to set premiums that are competitive while maintaining profitability. Different probability estimates for different customer segments enable precise risk-based pricing.
“How will this change over time?”—Time-Based Forecasting
- Key Characteristic: Incorporates temporal dependencies and seasonality
- Models: ARIMA, RNN and LSTM networks, transformer models, prophet, state space models
- Applications: Economic forecasting, resource planning, predictive maintenance, epidemiological modeling
- Business Value: Supports strategic planning and operational scheduling
Example: Walmart Staffing Optimization
Walmart forecasts customer traffic patterns throughout the day, week, and year. They predict that their Supercenter in Dallas will need 15% more cashiers on Sunday afternoons compared to Tuesday mornings, and 40% more staff during back-to-school season. This temporal forecasting enables optimal labor scheduling, reducing wait times while controlling labor costs.
27.3 “What patterns exist?”—Discovery Questions
Discovery models reveal hidden insights in data, enabling organizations to understand their markets, customers, and operations in new ways that drive strategic advantages.
Example: Spotify Music Discovery and Personalization
Spotify uses discovery models to understand music consumption patterns and user preferences:
- Cluster analysis reveals distinct listener segments (e.g., “Workout Warriors,” “Indie Explorers,” “Commuter Listeners”)
- Relationship discovery identifies which songs, artists, and genres naturally group together
- Anomaly detection flags unusual listening patterns that might indicate account sharing or emerging trends
- Structure discovery powers their recommendation algorithms and playlist generation
“What natural groupings exist in this data?”—Group Discovery
- Key Characteristic: Identifies similar entities without predefined categories
- Models: \(K\)-means, hierarchical clustering, DBSCAN, Gaussian mixture models, spectral clustering
- Applications: Customer segmentation, gene sequencing, market research, social network analysis
- Business Value: Enables targeted marketing and personalized product development
Example: Starbucks Customer Segmentation
Starbucks discovers that their customers naturally cluster into groups like “Morning Commuters” (quick coffee + pastry, 7-9 am), “Afternoon Socializers” (longer stays, specialty drinks, 2-4 pm), and “Evening Studiers” (long stays, minimal purchases, 6-10 pm). This segmentation enables location-specific store layouts, targeted promotions (commuter discounts during rush hour), and staffing decisions (more baristas during morning rush, more seating during evening study hours).
“What does not belong or is unusual?”—Anomaly Discovery
- Key Characteristic: Identifies deviations from normal patterns
- Models: Isolation forests, one-class SVM, autoencoders, statistical outlier detection, local outlier factor
- Applications: Fraud detection, network security, quality control, system monitoring
- Business Value: Protects against losses and identifies improvement opportunities
Example: American Express Fraud Detection
American Express flags unusual spending patterns: a customer who typically spends $200-300 monthly suddenly makes five $1,000+ purchases in different cities within 24 hours. The anomaly detection system automatically blocks the card and sends an SMS to verify the transactions, preventing fraudulent charges while minimizing inconvenience to legitimate customers.
“What is the underlying organization of the data?”—Structure Discovery
- Key Characteristic: Reveals latent organizational principles
- Models: Topic modeling (LDA), community detection, manifold learning, graph neural networks
- Applications: Document organization, social network analysis, recommendation systems, data visualization
- Business Value: Improves information organization and user experience
Example: LinkedIn Professional Network Analysis
LinkedIn discovers hidden professional communities within their network: a cluster of renewable energy professionals who do not work for the same companies but share connections, skills, and interests. This structure discovery enables them to surface relevant job opportunities, suggest networking connections, and create targeted advertising segments for companies looking to hire in emerging fields.
27.4 “What should I do?”—Decision Questions
Decision models directly drive actions and strategies, automating complex choices and optimizing outcomes in dynamic environments where human decision-making would be too slow or sub-optimal.
Example: Uber Dynamic Pricing and Driver Allocation
Uber uses decision models to optimize their marketplace in real-time (Section 2.8.2):
- Strategy optimization determines surge pricing levels to balance supply and demand across the city
- Resource allocation decides which drivers to dispatch to which areas based on predicted demand
- Choice recommendation suggests optimal routes to drivers and ride options to passengers
- Intervention planning determines when to offer incentives to drivers or discounts to riders
“What sequence of actions maximizes my objective?”— Strategy Optimization
- Key Characteristic: Learns through trial and error to optimize long-term rewards
- Models: Q-learning, policy gradient methods, Monte Carlo tree search, multi-armed bandits
- Applications: Game playing, autonomous vehicles, trading strategies, resource allocation
- Business Value: Automates complex strategic decisions in dynamic environments
Example: Google Ad Auction Bidding
Google optimizes bidding strategies for advertisers by learning which sequence of bid adjustments maximizes click-through rates while staying within budget. The system learns that bidding higher during lunch hours for restaurant ads and lower during late nights yields better overall performance. This dynamic strategy optimization improves advertiser ROI while maximizing Google revenue.
“Which option should I select from available alternatives?”—Choice Recommendation
- Key Characteristic: Suggests specific items or actions from a set of possibilities
- Models: Collaborative filtering, association rule mining, content-based filtering, hybrid recommender systems, contextual bandits
- Applications: Product recommendations, content curation, job matching, treatment selection
- Business Value: Increases customer engagement and conversion rates
Example: Netflix Content Recommendation
When a user finishes watching a thriller series, Netflix chooses from thousands of options to recommend “Dark” (similar genre + user history), “Stranger Things” (popular with similar users), or “Mindhunter” (trending in their region). The choice recommendation directly impacts viewer retention – users who receive good recommendations watch 75% more content and are less likely to cancel subscriptions.
“How should I distribute limited resources?”—Resource Allocation
- Key Characteristic: Optimizes allocation under constraints
- Models: Linear programming with ML components, reinforcement learning for scheduling, genetic algorithms
- Applications: Supply chain optimization, staff scheduling, portfolio management, network routing
- Business Value: Maximizes efficiency and minimizes waste
Example: FedEx Package Routing
FedEx decides how to allocate limited airplane cargo space and delivery truck capacity across millions of packages. The system determines that a high-priority medical shipment gets airplane space, routine packages go on trucks, and some non-urgent deliveries wait until the next day. This resource allocation optimization reduces delivery costs by 15% while maintaining service level agreements.
“When and how should I intervene?”—Intervention Planning
- Key Characteristic: Determines optimal timing and type of interventions
- Models: Survival analysis, uplift modeling, causal inference models, optimal stopping algorithms
- Applications: Medical treatment timing, marketing campaign targeting, maintenance scheduling
- Business Value: Maximizes intervention effectiveness while minimizing costs
Example: Salesforce Customer Success Management
Salesforce predicts when enterprise customers are at risk of churning and determines the optimal intervention strategy. For a customer showing declining usage, they might schedule a check-in call at the 30-day mark rather than 60 days, and offer training rather than discounts. This intervention planning increases customer retention rates by 23% while reducing the cost of retention efforts.
27.5 “Why did this happen?”—Understanding Questions
Understanding models provide explainability and causal insights essential for regulatory compliance, scientific discovery, and building trust in automated systems.
Example: Credit Card Company Loan Default Analysis
A credit card company uses understanding models to explain loan defaults:
- Causal explanation identifies which factors actually cause defaults (vs. just correlate with them)
- Feature attribution shows customers and regulators exactly why specific loan applications were denied
- Counterfactual analysis estimates how different credit policies would have affected default rates
- Mechanistic understanding reveals the underlying economic relationships that drive credit risk
“What caused this outcome?”—Causal Explanation
- Key Characteristic: Distinguishes correlation from causation
- Models: Causal inference models, instrumental variables, difference-in-differences, propensity score matching
- Applications: Policy evaluation, medical research, economic analysis, A/B testing
- Business Value: Enables effective interventions and policy decisions
Example: Airbnb Pricing Strategy Analysis
Airbnb determines that higher prices actually cause increased bookings in certain markets (signaling quality) rather than just correlating with demand. By using causal inference, they discover that a 10% price increase in luxury listings leads to 5% more bookings, while the same increase in budget listings reduces bookings by 15%. This causal understanding enables host pricing recommendations that maximize revenue.
“Which factors contributed most to this result?”—Feature Attribution
- Key Characteristic: Quantifies contribution of individual features to overall model or to individual predictions
- Models: SHAP (SHapley Additive exPlanations), LIME, attention mechanisms, feature importance methods, partial dependence, ICE (Individual conditional expectation)
- Applications: Model interpretability, regulatory compliance, scientific discovery, quality improvement
- Business Value: Builds trust and meets regulatory requirements
Example: JPMorgan Chase Loan Approval Explanations
When JPMorgan Chase denies a loan application, they can explain that credit score contributed -40% to the decision, debt-to-income ratio contributed -30%, employment history contributed +15%, and down payment amount contributed +10%. This feature attribution helps customers understand how to improve their applications and ensures regulatory compliance with fair lending laws.
“What would have happened under different conditions?”—Counterfactual Analysis
- Key Characteristic: Estimates outcomes under hypothetical scenarios
- Models: Counterfactual reasoning models, causal graphs, potential outcomes frameworks
- Applications: Policy analysis, personalized medicine, business strategy evaluation
- Business Value: Supports strategic planning and risk assessment
Example: Walmart Supply Chain Disruption Analysis
During the 2021 supply chain crisis, Walmart analyzed what would have happened if they had maintained larger inventory buffers. The counterfactual analysis showed that 20% higher inventory levels would have prevented 80% of stockouts but increased carrying costs by only 3%. This analysis informed their post-pandemic inventory strategy, balancing resilience with efficiency.
“How does this system actually work?”— Mechanistic Understanding
- Key Characteristic: Produces human-interpretable rules or equations
- Models: Physics-informed neural networks (PINN), symbolic regression, interpretable machine learning models
- Applications: Scientific modeling, engineering design, regulatory compliance
- Business Value: Enables system optimization and knowledge transfer
Example: Tesla Battery Performance Optimization
Tesla’s models discover that battery degradation follows the equation: \[ \text{Degradation} = 0.05 × (\text{Temperature} - 20°C)² × \text{ChargeCycles}^{0.8} × \text{FastChargeRatio}^{1.2} \] This mechanistic understanding enables them to optimize charging algorithms, set warranty terms based on actual physics rather than historical data, and educate customers on practices that extend battery life.
27.6 “What new content can be created?”—Generation Questions
Generation models create new value by producing novel content, solutions, and data that would be expensive or impossible to create manually, driving innovation and efficiency.
Example: Pharmaceutical Drug Discovery
Pharmaceutical companies use generation models throughout drug development:
- Molecular generation creates novel drug compounds with desired properties
- Synthetic patient data generation enables research while protecting privacy
- Clinical trial simulation generates scenarios to optimize study design
- Regulatory document generation automates compliance reporting and reduces time-to-market
“Can you create new examples similar to what I have shown you?”— Content Creation
- Key Characteristic: Produces realistic new instances of complex data
- Models: Generative adversarial networks (GANs), variational autoencoders (VAEs), diffusion models
- Applications: Image generation, music composition, synthetic data creation, art generation
- Business Value: Reduces content creation costs and enables rapid prototyping
Example: Nike Shoe Design
Nike generates thousands of new sneaker designs by training models on their existing catalog and consumer preferences. Instead of human designers creating each variation, the AI generates designs like “Air Max with honeycomb pattern sole, gradient purple-to-black upper, and breathable mesh panels.” This accelerates their design process from months to weeks while exploring design spaces that human designers might not consider.
“What would natural language say about this topic?”—Text Generation
- Key Characteristic: Produces coherent, contextually appropriate text
- Models: Large language models (GPT, BERT, Claude Sonnet), recurrent neural networks, LSTM models, transformer architectures
- Applications: Content writing, code generation, summarization, translation
- Business Value: Automates communication and documentation tasks
Example: Shopify Product Description
Shopify automatically generates product descriptions for millions of small business listings. For a handmade ceramic mug, it generates: “This artisan-crafted ceramic mug features a rustic glaze finish and comfortable handle design. Perfect for your morning coffee or evening tea, each piece is unique with subtle variations that showcase the maker’s craftsmanship.” This text generation helps small businesses create professional listings without hiring copywriters.
“What novel approaches could solve this problem?”—Solution Generation
- Key Characteristic: Explores solution spaces to find novel approaches
- Models: Genetic algorithms, neural architecture search, automated machine learning (AutoML)
- Applications: Drug discovery, engineering design, algorithm optimization, creative problem solving
- Business Value: Accelerates innovation and discovers non-obvious solutions
Example: Boston Scientific Medical Device Design
Boston Scientific uses evolutionary algorithms to design new stent configurations. The system generates novel lattice patterns and material combinations that human engineers had not considered, discovering that a spiral-hexagonal hybrid pattern provides 23% better flexibility while maintaining structural integrity. This solution generation reduces R&D time and leads to breakthrough medical devices.
“How can I create more training examples?”—Data Augmentation
- Key Characteristic: Generates additional training data while preserving important characteristics
- Models: Data augmentation networks, style transfer models, synthetic minority oversampling technique (SMOTE)
- Applications: Improving model performance with limited data, balancing data sets, privacy-preserving analytics
- Business Value: Improves model performance when data are scarce or expensive
Example: Autonomous Vehicle Training Data
Waymo creates synthetic driving scenarios to train their autonomous vehicles: rain at night with construction zones, snow with emergency vehicles, fog with pedestrians wearing dark clothing. Since these dangerous scenarios are rare in real-world data, the synthetic augmentation ensures their vehicles can handle edge cases safely, reducing the need for millions of miles of real-world testing.
27.7 Summary Tables
The following tables organize the preceding model classification in several ways.
Questions and Sub-questions
| Main Question | Sub Question |
|---|---|
| What will happen? | What specific numerical value should we expect? |
| Which category will this belong to? | |
| How likely is this outcome? | |
| How will this change over time? | |
| What patterns exist? | What natural groupings exist in this data? |
| How are these variables related to each other? | |
| What does not belong or is unusual? | |
| What is the underlying organization of the data? | |
| What should I do? | What sequence of actions maximizes my objective? |
| Which option should I select from available alternatives? | |
| How should I distribute limited resources? | |
| When and how should I intervene? | |
| Why did this happen? | What caused this outcome? |
| Which factors contributed most to this result? | |
| What would have happened under different conditions? | |
| How does this system actually work? | |
| What new content can be created? | Can you create new examples similar to what I have shown you? |
| What would natural language say about this topic? | |
| What novel approaches could solve this problem? | |
| How can I create more training examples? |
Question, Characterstic, Models
| Question | Characteristic | Models |
|---|---|---|
| What specific numerical value should we expect? | Target is a continuous numerical attribute | Linear regression, polynomial regression, neural networks, random forest regression, support vector regression |
| Which category will this belong to? | Target is a categorical variable | Logistic regression, decision trees, random forests, neural networks, naive Bayes, SVM classification |
| How likely is this outcome? | Target includes confidence intervals or probability distributions | Bayesian networks, probabilistic neural networks, calibrated classifiers, ensemble methods with uncertainty quantification |
| How will this change over time? | Incorporates temporal dependencies and seasonality | ARIMA, RNN and LSTM networks, transformer models, prophet, state space models |
| What natural groupings exist in this data? | Identifies similar entities without predefined categories | \(K\)-means, hierarchical clustering, DBSCAN, Gaussian mixture models, spectral clustering |
| How are these variables related to each other? | Reveals dependencies and interactions between variables | Principal component analysis, factor analysis, correlation networks, causal inference models |
| What does not belong or is unusual? | Identifies deviations from normal patterns | Isolation forests, one-class SVM, autoencoders, statistical outlier detection, local outlier factor |
| What is the underlying organization of the data? | Reveals latent organizational principles | Topic modeling (LDA), community detection, manifold learning, graph neural networks |
| What sequence of actions maximizes my objective? | Learns through trial and error to optimize long-term rewards | Q-learning, policy gradient methods, Monte Carlo tree search, multi-armed bandits |
| Which option should I select from available alternatives? | Suggests specific items or actions from a set of possibilities | Collaborative filtering, association rule mining, content-based filtering, hybrid recommender systems, contextual bandits |
| How should I distribute limited resources? | Optimizes allocation under constraints | Linear programming with ML components, reinforcement learning for scheduling, genetic algorithms |
| When and how should I intervene? | Determines optimal timing and type of interventions | Survival analysis, uplift modeling, causal inference models, optimal stopping algorithms |
| What caused this outcome? | Distinguishes correlation from causation | Causal inference models, instrumental variables, difference-in-differences, propensity score matching |
| Which factors contributed most to this result? | Quantifies contribution of individual features to overallmodel or to individual predictions | SHAP (SHapley Additive exPlanations), LIME, attention mechanisms, feature importance methods, partial dependence, ICE (Individual conditional expectation) |
| What would have happened under different conditions? | Estimates outcomes under hypothetical scenarios | Counterfactual reasoning models, causal graphs, potential outcomes frameworks |
| How does this system actually work? | Produces human-interpretable rules or equations | Physics-informed neural networks (PINN), symbolic regression, interpretable machine learning models |
| Can you create new examples similar to what I have shown you? | Produces realistic new instances of complex data | Generative adversarial networks (GANs), variational autoencoders (VAEs), diffusion models |
| What would natural language say about this topic? | Produces coherent, contextually appropriate text | Large language models (GPT, BERT, Claude Sonnet), recurrent neural networks, LSTM models, transformer architectures |
| What novel approaches could solve this problem? | Explores solution spaces to find novel approaches | Genetic algorithms, neural architecture search, automated machine learning (AutoML) |
| How can I create more training examples? | Generates additional training data while preserving important characteristics | Data augmentation networks, style transfer models, synthetic minority oversampling technique (SMOTE) |
Models, Applications, Business Value
| Models | Applications | Business Value |
|---|---|---|
| Linear regression, polynomial regression, neural networks, random forest regression, support vector regression | Stock price forecasting, demand forecasting, property valuation, weather prediction | Enables precise resource planning and financial projections |
| Logistic regression, decision trees, random forests, neural networks, naive Bayes, SVM classification | Email spam detection, medical diagnosis, customer churn prediction, image classification | Supports automated decision-making and risk assessment |
| Bayesian networks, probabilistic neural networks, calibrated classifiers, ensemble methods with uncertainty quantification | Risk assessment, medical prognosis, fraud detection, A/B testing | Enables risk-adjusted decision making and resource allocation |
| ARIMA, RNN and LSTM networks, transformer models, prophet, state space models | Economic forecasting, resource planning, predictive maintenance, epidemiological modeling | Supports strategic planning and operational scheduling |
| \(K\)-means, hierarchical clustering, DBSCAN, Gaussian mixture models, spectral clustering | Customer segmentation, gene sequencing, market research, social network analysis | Enables targeted marketing and personalized product development |
| Principal component analysis, factor analysis, correlation networks, causal inference models | Feature reduction, market basket analysis, scientific hypothesis generation | Identifies cross-selling opportunities and operational efficiencies |
| Isolation forests, one-class SVM, autoencoders, statistical outlier detection, local outlier factor | Fraud detection, network security, quality control, system monitoring | Protects against losses and identifies improvement opportunities |
| Topic modeling (LDA), community detection, manifold learning, graph neural networks | Document organization, social network analysis, recommendation systems, data visualization | Improves information organization and user experience |
| Q-learning, policy gradient methods, Monte Carlo tree search, multi-armed bandits | Game playing, autonomous vehicles, trading strategies, resource allocation | Automates complex strategic decisions in dynamic environments |
| Collaborative filtering, association rule mining, content-based filtering, hybrid recommender systems, contextual bandits | Product recommendations, content curation, job matching, treatment selection | Increases customer engagement and conversion rates |
| Linear programming with ML components, reinforcement learning for scheduling, genetic algorithms | Supply chain optimization, staff scheduling, portfolio management, network routing | Maximizes efficiency and minimizes waste |
| Survival analysis, uplift modeling, causal inference models, optimal stopping algorithms | Medical treatment timing, marketing campaign targeting, maintenance scheduling | Maximizes intervention effectiveness while minimizing costs |
| Causal inference models, instrumental variables, difference-in-differences, propensity score matching | Policy evaluation, medical research, economic analysis, A/B testing | Enables effective interventions and policy decisions |
| SHAP (SHapley Additive exPlanations), LIME, attention mechanisms, feature importance methods, partial dependence, ICE (Individual conditional expectation) | Model interpretability, regulatory compliance, scientific discovery, quality improvement | Builds trust and meets regulatory requirements |
| Counterfactual reasoning models, causal graphs, potential outcomes frameworks | Policy analysis, personalized medicine, business strategy evaluation | Supports strategic planning and risk assessment |
| Physics-informed neural networks (PINN), symbolic regression, interpretable machine learning models | Scientific modeling, engineering design, regulatory compliance | Enables system optimization and knowledge transfer |
| Generative adversarial networks (GANs), variational autoencoders (VAEs), diffusion models | Image generation, music composition, synthetic data creation, art generation | Reduces content creation costs and enables rapid prototyping |
| Large language models (GPT, BERT, Claude Sonnet), recurrent neural networks, LSTM models, transformer architectures | Content writing, code generation, summarization, translation | Automates communication and documentation tasks |
| Genetic algorithms, neural architecture search, automated machine learning (AutoML) | Drug discovery, engineering design, algorithm optimization, creative problem solving | Accelerates innovation and discovers non-obvious solutions |
| Data augmentation networks, style transfer models, synthetic minority oversampling technique (SMOTE) | Improving model performance with limited data, balancing data sets, privacy-preserving analytics | Improves model performance when data are scarce or expensive |
27.8 Framework Benefits for Practitioners
Question-First Approach
Rather than starting with “What algorithm should I use?”, practitioners begin with “What question am I trying to answer?” This leads to more appropriate model selection and clearer success criteria.
Business Alignment
Each category directly corresponds to business value:
- Prediction enables planning and risk management
- Discovery enables insights and understanding
- Decision enables optimization and automation
- Understanding enables trust and compliance
- Generation enables innovation and efficiency
Evaluation Strategy
Different question types require different evaluation approaches:
| Question Type | Primary Metrics | Secondary Considerations |
|---|---|---|
| Prediction | Accuracy, precision, recall | Calibration, fairness |
| Discovery | Interpretability, stability | Actionability, novelty |
| Decision | Business outcomes, ROI | Exploration vs exploitation |
| Understanding | Causal validity, explainability | Stakeholder comprehension |
| Generation | Quality, diversity | Originality, safety |