21 Assignments & Exercises
21.1 File Formats and Data Sources
Understand different file formats and their trade-offs; Practice reading and converting between formats.
Working with File Formats
- Multi-Format Data Conversion Pipeline
- Start with the provided
housing_data.csv(California housing dataset) - Using Python or R, convert this data to:
- JSON format (both array and object structures)
- Parquet format
- Create a DuckDB in-memory database and load the data
- Compare file/object sizes and note the differences
- Start with the provided
- Format Analysis Report
- Load each format back into your environment as Pandas DataFrame or as R dataframe.
- Time the read operations for each format
- Create a comparison table showing:
- File size
- Read time
- Memory usage
- Human readability (subjective assessment)
- Write a brief recommendation (1 paragraph) for when to use each format
- JSON Challenge
- Create a nested JSON structure representing a real estate portfolio with:
- Property details (from housing data)
- Owner information (create fictional data)
- Transaction history (create fictional data)
- Flatten this nested structure back to a tabular format using
pandas.json_normalize()or similar
- Create a nested JSON structure representing a real estate portfolio with:
Deliverables: Python/R script, comparison table, sample JSON files, brief format recommendations
Working with JSON Data
The file healthcare_data.json contains data on several patients from a single hospital in JSON format. Convert the data into data frames (R or Python) and answer the questions below. Make sure your code demonstrates how to retrieve the answers (since you could just visually scan the file to get some of the answers).
Answer the following questions:
- How many patients are in the data?
- What is the standard deviation of the patient weights?
- What is the average systolic blood pressure?
- What is the average diastolic blood pressure?
- How many pills per day does Sarah Johnson take?
- Which patient is allergic to stupid questions?
21.2 Data Access and SQL Fundamentals
Practice SQL queries and database connections; Work with DuckDB for analytics.
Basic SQL Queries
Use the california table in the ads.ddb database. Write SQL queries to answer:
- What are the 5 most expensive median house value areas by ocean proximity?
- Which areas have the highest population density (population/households)?
- Create a pivot table showing average median income by ocean proximity and housing age groups (create age bins: 0-10, 11-20, 21-30, 31+ years)
Some SQL Queries
- Suppose you run this query on table
foowith 10,000 rows. What value does it return?
select count(*) from foo limit 10;Customer Order Database–Basics
The customer.ddb database is a DuckDB database with several tables about an e-commerce business:
customers: 10 customers across different states, joined between 2019-2023products: 15 products across categories (Electronics, Appliances, Sports, Home, Health)orders: 25 orders with various statuses (completed, shipped, processing, cancelled)order_items: Junction table linking orders to products with quantities and prices
Products have price ranges from $15.99 to $149.99, multiple items per order are possible, orders have different statuses.
Answer the following questions.
- What are the different order statuses represented in the data?
- What is the percentage of canceled orders?
- What is the time frame during which orders were received?
- Which product category is ordered most frequently?
- Find all customers from California who joined after 2020.
- Calculate the total revenue and average order value for each month in 2023.
- Find the top 10 most expensive products and their categories.
For each question, show the SQL query and its output, and provide your answer based on the SQL return.
Customer Order Database–Basics, Second Set
A second set of basic queries for the customer database. The text in bold can serve as a hint how to tackle the question.
- Pattern Matching: Find all customers whose email addresses end with “email.com” and sort them alphabetically by last name.
- Date Filtering: List all orders placed in the second quarter of 2023 (April-June), showing order ID, customer ID, and order date.
- Numeric Filtering: Find all products priced between $25 and $75, ordered by price ascending.
- Count and Distinct: How many unique customers have placed orders? How many total orders have been placed?
- Text Functions: Display customer names in the format “Last, First” (e.g., “Smith, John”) for all customers from Texas.
- Conditional Logic: Create a query that categorizes products as ‘Budget’ (under $30), ‘Mid-range’ ($30-$80), or ‘Premium’ (over $80).
- Multiple Conditions: Find all completed orders from customers in California or Texas, placed after March 1, 2023.
- NULL Handling: Identify any records with missing data across all tables (this may return empty results with the sample data, but demonstrates the concept).
- Statistical Functions: For each product category, calculate the minimum, maximum, and average price.
Customer Order Database–Intermediate
This is a follow-up to the previous exercise, with intermediate SQL difficulty.
- List all orders with customer names and email addresses, showing only completed orders.
- Show all customers and their total number of orders (including customers with zero orders).
- Create a report showing customer name, order date, product name, and quantity for orders placed in the last 30 days.
- Find product categories where the average product price exceeds $50 and total sales volume is greater than 100 units.
- Rank customers by their total spending within each state, showing the top 3 customers per state.
For each question, show the SQL queries and output, and provide your answer based on the SQL returns.
Customer Order Database–More Joins
This is a follow-up to the previous exercise, with more join-related questions. The text in bold can be used as a hint.
- Right Join: Display all products and the total quantity sold for each (including products that haven’t been sold).
- Self Join: Find customers who share the same last name (hint: join customers table with itself).
- Cross Join with Filter: Create a report showing which customers have NOT purchased products from the ‘Electronics’ category.
- Join with Aggregation: For each customer, show their name, state, and total amount spent across all orders.
- Complex Join Conditions: Find all customers who have ordered the same product more than once (across different orders).
- Join with Date Functions: Show customer names and their most recent order date, but only for customers who have placed an order in 2023.
- Multiple Table Join with Filtering: List all order details (customer name, product name, quantity, total price per line item) for orders containing products from the ‘Sports’ category.
- Join with Subquery: Show customer information for those who have placed orders totaling more than $150.
- Outer Join Practice: Create a comprehensive report showing all customers, all their orders (if any), and all order items (if any), including customers who have never placed orders.
For each question, show the SQL queries and output, and provide your answer based on the SQL returns.
Customer Order Database–Advanced
This is a follow-up to the previous exercise, with more advanced SQL queries.
- Find customers who have spent more than the average customer spending.
- Using a Common Table Expression (CTE), identify products that are frequently bought together (appearing in the same order).
- Find the most recent order for each customer along with the order total. For each question, show the SQL queries and output, and provide your answer based on the SQL returns.
In-database Analytics
Refer to the ducksummary function written in R in Section 17.7. Implement the ducksummary() function from the text in Python and repeat the analyses from the text.
21.3 Data Quality Assessment and Cleaning
Identify and address data quality issues; Implement data profiling and cleaning workflows.
Data Quality Report
Based on the profiling report for the customer quality data in Section 16.3, identify data quality issues from across the dimensions accuracy, completeness, consistency, timeliness, validity, and uniqueness.
Produce a data quality report, it should address
- Completeness rates
- Validity percentages
- Duplicates
- Outliers
- Format inconsistencies
- Improvement strategies such as validation rules and standardization
Some things to consider:
- How do you check for duplicate values in a column versus duplicate rows in Python?
- Use of regular expression (
import re) to search for and match patterns - Type conversions of columns with the wrong data type.
- Conventions: how accurate does a birthday date have to be, compared to, say, the date/time a record has been updated?
Data Quality Function
Use the customer_quality table in the ads.ddb database.
- Data Quality Assessment
- Implement a data profiling function that calculates:
- Completeness rates by column
- Duplicate detection (exact and fuzzy)
- Outlier identification using Z-scores and IQR methods
- Format consistency checks
- Create a data quality dashboard using a visualization library
- Implement a data profiling function that calculates:
- Data Cleaning Pipeline
- Develop a step-by-step cleaning process that:
- Handles missing values (multiple strategies)
- Standardizes formats
- Removes/flags outliers
- Removes duplicate records
- Document your decisions and rationale for each cleaning step
- Compare before/after statistics
- Develop a step-by-step cleaning process that:
21.4 Summarization
Create meaningful data summaries. Develop effective visualizations for exploratory and presentation purposes. Verify results mathematically.
Show that …
Show that \(r_{xy} = r_{yx}\) and that \(r_{xx} = 1\). Then show that the same holds for the correlation \(\text{Corr}[X,Y]\).
Algebraic Equivalence
Show the following identities algebraically. \[ \begin{align*} \sum_{i=1}^n\left(x_i - \overline{x}\right)^2 &= S_{xx} - S_x^2/n \\ \sum_{i=1}^n\left(x_i-\overline{x}\right)\left(y_i - \overline{y}\right) &= S_{xy} - S_xS_y/n \\ r_{xy} &= \frac{S_{xy}-S_x S_y/n}{\sqrt{\left(S_{xx}-S_x^2/n\right)\left(S_{yy}-S_y^2/n\right)}} \end{align*} \]
\(r_{xy}\) is the Pearson product-moment correlation coefficient, often written as \[ r_{xy} = \frac{\sum_{i=1}^n(x_i - \overline{x})(y_i-\overline{y})}{\sqrt{\sum_{i=1}^n(x_i-\overline{x})^2\sum_{i=1}^n(y_i-\overline{y})^2}} \]
Sufficient Statistics Aggregation
Enhance the R or Python function in Section 17.5 to accommodate missing values in one or more of the input columns in the following two ways:
Using a complete-case analysis that removes any row from the calculation that contains missing values for any of the analysis variables.
Using an analysis that accumulates the sufficient statistics for each variable or pair of variables independently. For example, if \(x_i\) and \(y_i\) have been observed, and \(z_i\) is missing, then \(x_i\) and \(y_i\) can contribute to \(S_{x}\), \(S_{xx}\), \(S_y\), \(S_{yy}\), and \(S_{xy}\).
How do you need to adjust the arrays accumulated in the function to accommodate the two ways of handling missing values?
Validate your function by setting randomly 20% of the observations in the data to missing. Make sure that every column contains some missing values.
In-database Analytics
Enhance the ducksummary() function in Section 17.7 to allow a list of analysis variables and a list of GROUP BY variables.
Use the enhanced function to compute summaries for the Ripeness, Sweetness, Acidity, and Weight variables with and without grouping by Quality for the banana_train data set.
Compute the average bill length in mm by species and island for the penguins data set using in-database analytics.
Salary Survey
Use the SalarySurvey table in the ads.ddb database.
- Comprehensive Data Summarization
For the data, create- Summary statistics by categorical groups
- Correlation analysis between numeric variables
- Time-based trend analysis
- Geographic analysis (if applicable)
- Visualization Portfolio
- Create both exploratory and presentation-quality visualizations:
- Exploratory: Quick plots for personal analysis (histograms, scatter plots, box plots)
- Presentation: Polished graphics for stakeholder communication
- Include at least one multi-panel (trellis/faceted) plot
- Apply the “trifecta checkup” (Question-Data-Visualization) to each graphic
- Create both exploratory and presentation-quality visualizations:
Customer Data
Use the customer_quality table in the ads.ddb database.
- Comprehensive Data Summarization
For the data, create- Summary statistics by categorical groups
- Correlation analysis between numeric variables
- Time-based trend analysis
- Geographic analysis (if applicable)
- Visualization Portfolio
- Create both exploratory and presentation-quality visualizations:
- Exploratory: Quick plots for personal analysis (histograms, scatter plots, box plots)
- Presentation: Polished graphics for stakeholder communication
- Include at least one multi-panel (trellis/faceted) plot
- Apply the “trifecta checkup” (Question-Data-Visualization) to each graphic
- Create both exploratory and presentation-quality visualizations:
21.5 Visualization
Trifecta Checkup
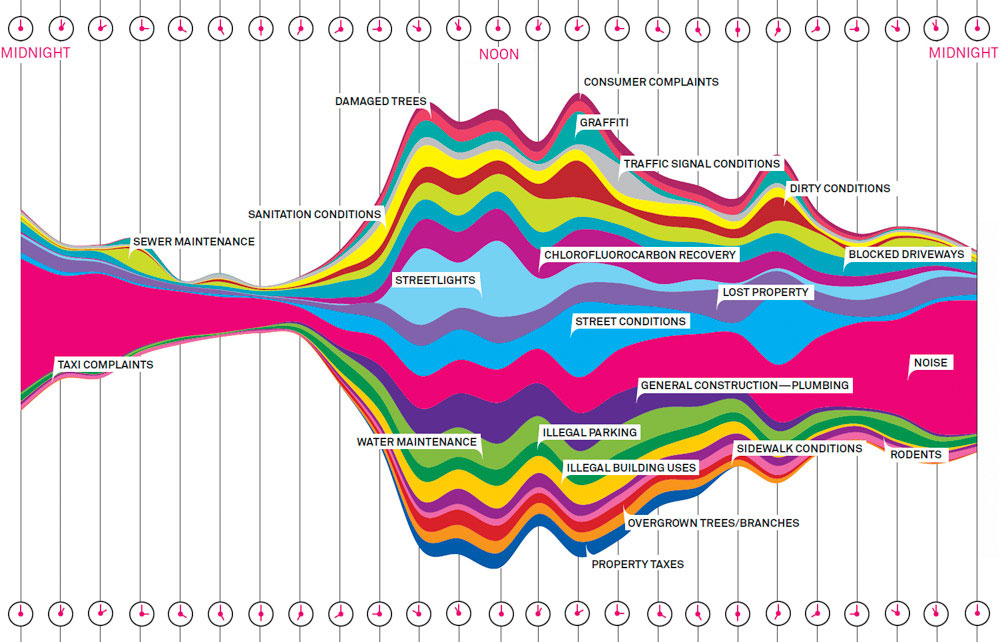
311 is a non-emergency telephone service used in many North American communities to access municipal government services, information, and to report problems such as potholes, graffiti, noise complaints, etc.
Figure 21.1 depicts 311 calls in New York City by hour of day.
Give the graphic the trifecta checkup covering all three dimensions (Question–Data–Visualization).
The data displayed in Figure 21.1 is circular data; unlike linear data it has a periodic nature: the right hand edge connects to the left hand edge of the plot. Suggest a different display for the 311 call data that incorporates the circular nature of the data.
Conditional Plots
The sleep table in the ads.ddb database contains data from a longitudinal sleep study on eighteen subjects. The subjects were observed over ten time points and their reaction time to increasing sleep deprivation was measured.
The sleep_predvals.csv file contains predicted values of the sleep deprivation from a statistical learning model that models variation at the level of the population (the average subject) and at the level of the individual. So for each subject and time point, there are two predicted values.
Create a presentation style conditional plot (trellis plots) that shows the observed data for each study subject overlaid with the two types of predictions for that subject.
You can use the lattice package in R , ggplot2 in R or plotnine in Python to produce the plot.
21.6 Data Integration Mini-Project
Integrate data from multiple sources. Handle real-world integration challenges. Design a simple data pipeline.
- Multi-Source Integration
- Obtain data from at least 3 different sources/formats:
- CSV file (e.g., economic data)
- JSON from an API (e.g., weather, census, or financial data)
- Database table (create or use existing)
- Sources should be logically related (e.g., all about the same geographic regions or time periods)
- Obtain data from at least 3 different sources/formats:
- Integration Challenges
- Address typical integration issues:
- Different date formats
- Mismatched geographic identifiers
- Different levels of granularity
- Missing values in key linking variables
- Document each challenge and your solution
- Address typical integration issues:
- Simple ETL Pipeline
- Create a pipeline that:
- Extracts data from each source
- Transforms and standardizes formats
- Handles data quality issues
- Loads into a unified format (database or structured files)
- Include error handling and logging
- Create a data lineage diagram showing data flow
- Create a pipeline that:
- Business Value Analysis
- Demonstrate insights only possible through integration
- Create a brief report (2-3 pages) showing:
- What questions can now be answered that couldn’t before
- Key findings from the integrated dataset
- Recommendations based on the analysis